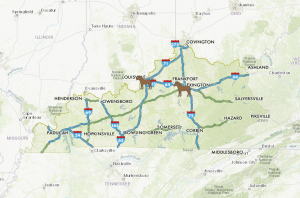
Grogan – Week 5

Chapter 7 introduced 3D web maps, or web scenes, and showed how they make interpreting and analyzing data more intuitive and engaging. I liked learning about different scene elements like surfaces, textures, and atmospheric effects, and I thought the texture features made maps much easier to understand. The chapter also introduced Lidar, which uses laser-based point clouds to measure elevation and other features. I explored how to use Web AppBuilder to create interactive web apps with themes and widgets without coding, and I found it helpful to see how different tools like Query and Filter widgets can make apps more dynamic. I also found it fascinating how 3D technologies like VR, AR, and indoor GIS are being used to create detailed, immersive maps.

An app idea would be to use 3D maps to show in my home time Louisville, Kentucky and maybe show some patterns with Derby participants since the Derby is coming up. People up here at school most likely have never been and it would be fun to show people how huge it actually is at home.

Grogan – Week 4

Chapter 6 introduced spatiotemporal data, which connects information to both time and location, and showed how it’s used in real life GIS. I found it interesting how real-time data can support emergency response, environmental monitoring, and business operations. The chapter explained different types of spatiotemporal data, the role of IoT devices, and tools like ArcGIS Dashboards and time-enabled layers. It was really helpful to see how live data can be visualized and animated to track changes over time.

Grogan – Week 3

In Chapter 3, I learned about the ArcGIS Experience Builder, which lets you create custom web experiences with flexible layouts and interactive widgets. It’s really useful when a standard web app doesn’t meet your needs. The tutorials were helpful, but it took some time to get used to working in a web-based environment after using local software all semester. I liked how the Experience Builder can make GIS more accessible even for people with little experience.

Chapter 4 focuses on how mobile devices are becoming the main platform for Web GIS. I thought it was really interesting that GIS can even work on wearable devices like Apple Watches. I also liked how the chapter introduced different Esri mobile apps and explained them clearly. The idea of rapid data collection and the shift toward mobile GIS made me realize how important it is to access data quickly and easily, especially in the field.

One application would be a wildlife tracking app where users can log wildlife sightings (species, location, time, photo) directly from their mobile devices. Using Web GIS, the data could be mapped in real-time to help conservationists monitor animal populations, migration patterns, or even invasive species. The Experience Builder could make it easy for users to view maps, contribute data without needing coding experience, and even get alerts if they are near sensitive habitats. This would help connect everyday people to environmental research while building a large, useful dataset for scientists.

Grogan – Week 1

Hi, my name is Abbie Grogan. I am from Louisville, Kentucky and I am a Pre-professional Zoology major with a Chemistry minor. I am a junior here and I am a captain of the OWU women’s lacrosse team.

Since I took 291, I am confident in my abilities to maneuver and work through ArcGIS online. Those computers loved to give me issues last semester for the longest time, so I am very happy to avoid those now. I completed the ArcGIS Online Basics course, which introduced me to fundamental GIS concepts and highlighted the powerful features of ArcGIS Online. One of the most valuable aspects I learned about was how feature layers allow for detailed data visualization, which aids in analyzing trends across different locations. I also gained an understanding of the Web AppBuilder, a tool that enables users to create interactive applications without requiring coding skills. This makes GIS tools much more accessible to those without technical backgrounds but who still need to utilize geographic data.

The first thing I found when looking through Google Scholar was a guy named Ranjani Varaghur doing a study through Penn St University on the soil in the Big Elk Watershed area. This map is the elevation of the area he was doing his experiment.

The second map that I found was a collected list of D1 lacrosse players and where they come from. The map shows the sport has been growing nation wide as it was really only popular on the east and west coast of the US for a long time.