Deem Week 4

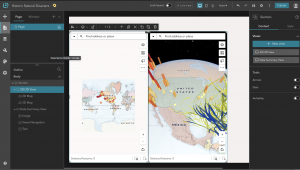
Chapter 5: This chapter goes over the intricacies of ArcGIS Enterprise, which to my understanding is a form of ArcGIS online. It includes data from the Esri cloud, with the difference being that Enterprise is a locally managed app/databank to be used by members of an organization. It has a wide variety of apps and features that can be implemented, such as ArcGIS Servers, ArcGIS Web Adaptor, ArcGIS Data Store, etc.  This chapter also goes over the different web layer types that can be created in ArcGIS Online and ArcGIS Enterprise, such as raster tile layers that are created from image files, vector tile layers that are more customizable and use the PBF file format, and map image layers that can be drawn by the server or by using files from a cache.

Chapter 6: This chapter is about spatiotemporal data, which includes things like moving data points that can be used for EMS purposes (tracking ambulances, fire engines, squad cars), and fixed data points like crimes, points of interest, and car crashes. The chapter also covers real-time GIS which covers continuous data points which change over time. Examples of this are temperature, wind speed, and precipitation. An interesting topic in this chapter is IoT, or Internet of Things. This refers to the modern phenomenon where a lot of the things we use to live our day-to-day lives are capable of sensing conditions and communicating with one-another. A good example of this are smart cars that are capable of self driving. These cars use the IoT in tandem with built-in sensors and computers to calculate their own position as well as the position of things around them, even in conditions that humans would not be able to see well in.  It was also interesting to do the tutorials for this chapter and see that the map was updating in real time.

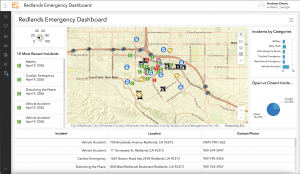
An application for chapter 6’s information could be used on trail maps to report things like trail obstructions, hazardous conditions, and sightings of dangerous wildlife. Trail cams could be used along with hiker reports to create a map for the trail that could be used by park rangers.

Deem Week 3

Ch. 3: The map portion of this chapter went very well and I was able to easily create the maps needed. I can see how this would be useful in displaying all sorts of data. However, I had several issues with the data summary portion. First of all, I found out that using the link given in the tutorial does not work on a MacBook, so I had to go to the link in my browser, download the image, and upload it manually. Secondly, the views navigation widget would not work, which might be why I could not get the dynamic content widget to work later on, even though I made sure I was following the instructions.

Ch. 4: I had several issues with this chapter as well, most notably that the URL that had our data for the chapter would not load when I typed it into my browser. I skipped the first and second  tutorials because I could not obtain the data for them, though I was able to get the gist of it from reading the instructions. On the third tutorial, I noticed that a number of the instructions did not exactly line up with the website. I assume this is because the book was made in 2022 and the website has been updated since then. Because the website is similar enough to how it must have been when the book was published, I was still able to do these tutorials. This part of the book was really useful for getting some experience in using some of the apps ArcGIS has to offer.

I think that an interesting way of implementing what we learned in these chapters would be to make a map of forest density across the U.S.. The data could be displayed similar to how it was in the tutorial for the chapter 3 map, though in the case of the 3D map the entire region would need to be a raised data point as opposed to the skinny data ‘poles’ used to describe the buildings and their height.

Deem week 2

Chapter 1:

Chapter 1 offers a brief history of WebGIS, including how it has evolved over the years from a program housed locally on stationary computers to a website that is far more accessible to a wide variety of devices. Similar to what we learned in GEOG 291, this chapter talks about how GIS online and computer services have revolutionized the world of mapping and have greatly improved the ways that geography and spatial information are shared. This revolution in mapping technology has provided a great deal of conveniences for people who need to use mapping in their everyday lives, which includes a large portion of the general population. For example, many of us use some sort of mapping software on our phones to get directions when we need to go somewhere, and we use other mapping software to find out where and when weather events will occur.


Chapter 2:

This chapter made it easier for me to understand the ways that webGIS  is similar and different from the ArcGIS software we used in GEOG 291. The similarities lie in concepts like feature layers  which are fundamental for both ArcGIS software and webGIS applications. The differences can be seen in features like the smart mapping tool, which automatically suggests ways that the map can be designed for greater visual appeal. Previously in GEOG 291, we had to design our maps through the symbology menu, which included manually picking out options for how we wanted data points to appear. This chapter also details a system called the ArcGIS Living Atlas, which is a compilation of many data sets which can be downloaded for use in individual projects.


Potential applications:

While I was reading these chapters I was thinking about how cool it would be if these maps could be utilized for the state parks and hiking trails  in Ohio. For instance, they could display information online such as trail conditions and hazards as reported by people who have hiked them earlier in the day. Also, information on campground site availability and campground events could prove to be a useful and interesting application of these ideas.

Deem Week 1

My name is Andrew Deem and I am a first year student at Ohio Wesleyan. I am majoring in botany with a minor in environmental studies because I enjoy being outside and find plants particularly interesting. I am from Marion, Ohio and took GEOG 291 earlier this semester. I have completed the quiz.

Esri account:

Comment 1 – The first thing I noticed about this website is that all of the links around the profile area took a lot longer to load than other links for some reason.

Comment 2 – I noticed that the links for “My Esri” and “Profile and Settings” led to the same place.

Getting Started:

Comment 1 – This portion reminded me of some of the basics I learned in the geography 291 course and refreshed my memory on this topic.

Comment 2 – I noticed that our accounts have access to a number of apps related to ArcGIS, so I wonder if those will come up later in the course.

Esri Training:

Comment 1 – I found that this training helped me to remember some of the details about the class I took earlier this semester as well as teaching me a few things about how ArcGIS operates.

Comment 2 – I can see how ArcGIS and other Esri applications could be useful in corporate or other group oriented careers. I learned a lot more about the group functionality of these services in the web course.

I was able to find some GIS applications related to my interests, such as this one which shows the return amount from corn and soybeans that was expected in 2015. The map shows a large portion of the midwest and east coast and demonstrates how some areas performed better than others in terms of profit that year.

This map shows worldwide deforestation from several causes. Maps like this are useful for getting a point across quickly, such as in this case showing how South America and parts of Africa have been greatly affected by deforestation.

Conflicting Data: How Fast Is the World Losing its Forests? - Yale E360