Johnson Week 5

While chapter 7 was really interesting and fun to get into, it was definitely really overwhelming as it almost felt like there was an entirely new version of the programming to learn. When I first started, I saw that there had in fact been an update, but during the tutorial, it was a bit difficult to find different things that had been mentioned. Beyond that though, the different additions that can be added to maps like bushes, trees, cars, bodies of water that almost have their own animation style, and so many other things was really cool to see! In this 3D version of the GIS program, previous content learned can be applied to an even further and more realistic way. There are different forms, such as VR, or virtual reality that can be more accessible, convenient and in some instances, reliable for users when this augmentation is applied. 

Application Idea: Seeing how much I was able to do after reading chapter 7, I think it would be a cool idea to map where all the Ginkgo Trees are on campus as when they begin dropping the putrid smelling fruit during the colder months of the academic year, a lot of students become nauseated at the smell. I thought that it would be cool to jot down the areas where the trees are, both on academic and residential sides of campus so students could be more aware of where to watch their step to avoid stepping on the smelly fruits, as well as being aware of what areas might be the stinkiest depending on how populated the density of the female Ginkgo trees are in that area! This map could have a simple outline of the academic buildings, different walkways, benches, parking lots, and possibly even some of the statues and boulders we have around campus!


Johnson Week 4

Real-time GIS has the ability to ingest real-time data, real-time visualization of data, GeoEvent and velocity, alerting, update schema, add  additional processes, ArcGIS online feed items, and feature layers. In Chapter 6, these abilities are touched on as well as allowing the ability to see different patterns over time. For example, a map tracking real-time traffic in an area also has the ability to go back days, weeks, months and even years and display objects, traffic patterns, weather patterns, and accidents that allow people to use this information and make inferred guesses on how these patterns will carry out in the future.

Application Idea: Having previously worked at Planet Fitness for 2 years, a gym that alleges a no judgment zone, we had a popularity tracker that was on our website and app. On it, guests could see what hours were most popular pertaining to visitation rates, hours that were slower, and recommended times to go. All of this information was kept up to date with real-time statistics coming in based off of the check in swipes of guests. That being said, this information was not specifically Real-Time GIS, but the design is relatively the same. After seeing different maps based on population and traffic patterns, I thought a good idea would be to implement something for OWU students, or even just Delawarians that businesses and eateries could use for every customer and person either using whatever said facility or are present. This could help for busier times such as First Fridays, to let people know how many people are present, inferred wait times, and other places that are less busy. The same would be true for OWU campus in regards to dining halls.

Johnson Week 3

Chapter 3

ArcGIS Experience Builder is a tool that allows you to create different types of content, that does not require exuberant code to do so / very low code. Along with the creation of different content, some specific methods of using this tool are widgets, 2D and 3D data can be drag and drop interface, custom tools, integration of other apps, mobile optimization (mobile GIS down below), and different templates.


Chapter 4

Mobile GIS is a combination of the traditional GIS software onto a smaller piece of technology– something that is portable, (i.e. cellular phone, tablet, laptops). MobileGIS provides access to downloadable geospatial data, printable maps and interactive mapping applications. While Mobile GIS does have relatively amazing abilities for the physical size of technology the program is being run on, the smaller size of the screen causes lack of visibility to some degree. 


Application: Based on some data that I have seen using applications of Mobile GIS and ArcGIS Experience Builder, I think that having a study and inspection of areas affected by gas-leaks over the last 10 years within Delaware County lines. Many people are affected by spontaneous gas leaks, but also ensuring that these are solely spontaneous, are not occurring in patterns, and studying the areas and the people affected by these would ensure the safety of people and animals nearby. Along with this, some sort of method of obtaining information besides surveys and technological monitoring devices should be used.

Johnson- Week 1

Hello! My name is Ava and I am currently a junior with senior status! My major is East Asian Studies and I just returned from Studying abroad in Japan last semester! I took a course with previous professor Katsutoshi and was on the TPG to study soil in Japan, but I decided it was best to come home early to see my family and dog, Biggie Smalls! This is my first GIS course that I am taking, so I am very excited to be shown the ropes and discover everything that it has to offer. After taking the ESRI ArcGIS Online Basics, I did some digging on the site and found a lot of interesting articles and maps that did not pertain to more scientific studies. I figured that since it was more of a geographic mapping system, that everything there would be more likely than not about mountains or trenches, so I was pleasantly surprised to find that this was not the case in so many instances. 


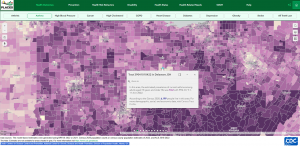
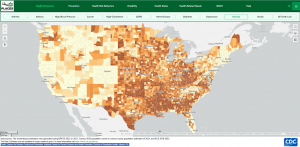
Race and Ethnicity in the US by Dot Density (2020 Census)

I thought that this map with population density categorized by race was extremely interesting as like I previously mentioned, this was definitely not a map that I thought would be listed, nor did I fully comprehend would be made using this programing either.

Get Started: What is ArcGIS Online 

Public accounts are available for use, but have limitations in terms of what can be used and viewed. While there are limitations, there are still many things to access and functions to use. Public accounts are not associated with any organization. 

Something else I had found that will be extremely useful for the future assignments as well as I had found it interesting was the “Get Started with Map Viewer”. Not only was it a basic breakdown/introduction to the Maps’ feature, but it also had uses for functionality, detailed explanations, and pictures as well for clear instructions.

Johnson Week 2


Chapter 1.Introducing GIS-

 GIS gives just about unlimited access to the information of a place without having to physically go there. For example, identification of land features, climate, boundaries, population, resources and other things can be accessed just from the web using a geographic information system. Different analyses can be formed as well based on information gained from using GIS, like evolution, anticipation of future conditions based on current ones, finding locations for different needs, tracking diseases and starting points of spread, and many other examples. GIS allows room for exponential growth in terms of tracking, discovering and examining data. Usage of layers on GIS on maps also lays down the foundation for unique and hyper detailed viewing of certain characteristics that would otherwise be difficult to map, such as transmission lines, coal basins, shapes of geometrical forms, and other geographic features. With this, zooming, shrinking are at the fingertips of all users of GIS. 

Chapter 2. Introducing ArcGIS-

On GIS, there are feature layers, raster layers, scene layers, service layers, query layers, selection layers, subtype layers, voxel layers and graphics layers. Layers can be overlaid with one another and the result differs based on interaction with other layers. ArcMap- GIS application for analyzing and creating maps. ArcCatalog- application for management of data, deals with organization and documentation of spatial data. There are also different uses of ArcGIS for different people, such as ArcGIS for developers, professional usage of ArcGIS, and ArcGIS apps. Along with this, ESRI data is also available for use, things such as Smart Mapping, which is ESRI’s interactive program that enables users to quickly and efficiently navigate and spread data that has been inserted into maps. And Tapestry, which is ESRI’s segmentation data and divides different areas of towns, such as neighborhoods, into divisions based on socioeconomic and demographic characteristics and factors. 

Application-
My application based idea would be to include more detailed areas of surface elevation, higher and lower around Ohio, but specifically Delaware Ohio. I think that doing this would not only be beneficial for construction agencies, but also the people that live and interact with these areas frequently. For example, roads such as Elizabeth Street, South Liberty Street, South Washington Street, and South Sandusky street are all on higher elevations of hills that people in wheelchairs or physically handicapped may be unable to venture due to said elevation. Along with that, construction would be increasingly expensive as proper tools, infrastructures and supports need to be included for safe projects to be completed.