Chapter 7:
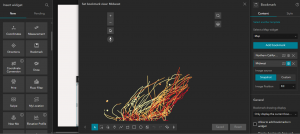
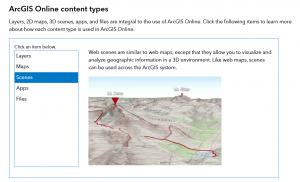
- 3D scenes are an important part of GIS, since they allow for another dimension of data visualization, and thus ArcGIS Online allows you to make 3D web scenes.
- 3D scenes can be grouped into 2 categories, Photorealistic, and Cartographic, and depending on scope can also be separated into global and local categories.
- 3D GIS is helpful for displaying conditions like topographic height, visibility, or for giving additional insight that a 2D map would be unable to provide
- There are many ways to display 3D layers, such a rasters or point cloud images, or even using 3D objects, each with distinct advantages and disadvantages
- VR and AR can also be used in conjunction with 3D GIS, allowing for users to view data as if they were within the scene.
- Indoor 3D GIS has important applications in warehouse management, where it can be used to effectively map and manage resources within a building.
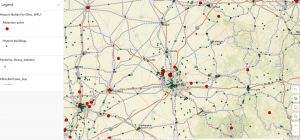
One application that could be created using a 3D scene would be a topographic map of Delaware county with the rail lines overlaid on top of it, in order to give a better understanding of the various track grades present throughout the county.