Walz – Week 6

  1. Below is a link to my first final project, a 3D scene viewer of Hannah Park in Gahanna, Ohio.

https://arcg.is/0nSumr

2. Below is a link to my second final project, an instant map that allows you to view an attachment (image), short description, and the location of various Art Museums around Columbus, Ohio.

https://owugis.maps.arcgis.com/apps/instant/attachmentviewer/index.html?appid=0ab8020be53646ed9695f9600d81a8b4

Walz – Week 5

Walz – Week 5

Chapter 7:

Chapter 7 went over 3D webscenes in ArcGIS. A webscene is basically a 3D version of a web map, with there being different types of 3D scenes like global scenes (round earth) and local scenes (flat earth), and the chapter explaining how 3D is useful for more realistic views of data, like for modeling or visualizing buildings and landscapes.

  • Scene layers are special 3D layers for large datasets; several types like point cloud layers, 3D object layers, or even integrated mesh layers which seem to be like a drone 3D model thing
  • Surfaces like elevation, textures, shadows and lighting can be shown on 3D scenes along with things above and below the ground. Some tools also mentioned like ArcGIS, AR viewers can support this 3D workflow
  • VR is virtual reality whereas AR is augmented reality and XR is all real and virtual combined environments
  • Indoor GIS is a thing, which is useful for mapping things indoor as opposed to the typical outdoor mapping that GIS programs do
  • ArcGIS urban is made for urban planning
  • Tutorial 7 had me create different web scenes. One of them used cyclone data where height showed wind speed, and colors showed wind pressure. Another section had me build a fun park using 3D object symbols. I added layers from GTKWebGIS and adjusted the symbols baked on attributes like Object type,size, and rotation. Each point type had a specific 3D symbol (trees, benches, rocks) and rotation/size affected how they appeared in the 3D viewer. I also changed the lake to a blue polygon and messed with shadows. I then tried to use the Web Appbuilder to make a 3D web app for my fun park but I couldn’t quite find all the buttons.


One application idea is creating a 3D web scene that can let users explore a local park’s landscape design in 3D. I would have a basemap of the park, add point layers for things like trees or benches, create a few slides for important areas like ponds or a walking path. Then I would add polygons for grass areas and try to make it look decent.

Walz – Week 4

Walz – Week 4


Chapter 5:

Chapter 5 went a lot over how ArcGIS enterprise works, how this hybrid model is ideal for security but also functionality and how one can use ArcGIS pro to compare tiles on ArcGIS online/enterprise

  • Sometimes you may need to build a private WebGIS due to security or functionality reasons
  • You can build this private WebGIS through ArcGIS enterprise
  • In places with restricted internet like government buildings, will need to use on-premise WebGIS
  • ArcGIS enterprise is an on-premise, user managed part of the Esri Cloud. Basically ArcGIS enterprise is just a variation of ArcGIS online
  • The specifics on how ArcGIS enterprise is connected to GIS servers are a little bit confusing but it seems to be highly secured
  • ArcGIS enterprise like ArcGIS online can create and host multiple web layers with various features
  • Many of the GIS products conform to a specific standard in order to keep things uniform
  • Can use weblayers from ArcGIS pro for ArcGIS online and enterprise
  • I tried doing tutorial 5 but for ArcGIS pro wasn’t working so I plan on reinstalling the application and deleting some old projects as my laptop is running a bit slow from all the downloads, so I will attempt this later
  • Though from what it looks like, you can use ArcGIS pro to basically compare with other tiles like vector and raster tiles on ArcGIS online / enterprise


Chapter 6:

  • In this chapter, it seems the data file type is csv. Which I believe is what we used for ArcGIS story maps as well. Then from that data  you can create a feature layer and then use instant app templates and the ArcGIS dashboard
  • Time is an important dimension of ArcGIS; spatiotemporal data can be categorized into these categories; moving, discrete, stationary, and change. Most of these are pretty self explanatory
  • On GIS a time value can be either a point of time or a duration of time
  • loT collect sensor data that can be shared and presumably update maps in real time
  • Lots of smart devices have this sensor feature to get real time data to you
  • ArcGIS velocity allows user to capitalize on sensor data for Esri projects
  • Dashboards can be updated with real time data, can display things like wind speed, or measles cases
  • Tutorial 6 had me explore various ArcGIS applications focusing on real time and temporal GIS. I built a web map with live data layers that showcased things like traffic, and incidents, and then I customized it but I didn’t want to share it. I then created an operations dashboard that visualized real time emergency information, but it was kind of wonky. Afterward I made a time enabled feature layer from historical US pop. data and made it into an animated map and then I did a time aware map that animated 200 years of US population growth, which showed trends over time.


One application idea is creating a time aware map over really any data I could realistically collect or get a hold of that a time aware would make sense. Like for example; looking at urban growth within a city or how wildlife have decreased over time in an urban area.

Walz – Week 3

Aiden Walz – Week 3

Chapter 3:

Chapter 3 went over the ArcGIS experience builder and how it’s a hodgepodge of multiple features and apps together that the user can customize to include more functionality than any individual ArcGIS instant app.

  • Able to create 2D and 3D web apps for multiple devices
  • Includes multiple widgets for different functions and allows for customization
  • Has flexible layouts to build maps that are map/non-map centered and can be viewed as multiple or single pages
  • Can select a premade template  or start from scratch
  • Allows ability to select a theme and add source data 
  • Basic widgets include things like map, legend, layers and more
  • Layout widgets include things like section, column, row and more
  • Widget settings include; content, style, action
  • Content defines the data sources
  • Style defines the how it appears basically
  • Action defines how widgets interact with one another
  • Experience builder has three editions: One in ArcGIS Online, one in portal for ArcGIS, one  in developer edition
  • Portal and developer allow for customization of widgets, online doesn’t 
  • Tutorial 3 went over developing a public web experience to view data about historical earthquakes and hurricanes
  • Web app was able to display the earthquake data as a 2D and 3D map using map widgets
  • I personally think the 2D map looked better visually than the 3D
  • I added a text widget to the Data summary view to show some basic information about the earthquakes and hurricanes layer
  • Then I used a table widget to display attributes of the earthquakes
  • Overall a I used a lot of different widgets to visualize or showcase information about the data source


Chapter 4:

Chapter 4 went over the mobile GIS part of ArcGIS online as mobile devices are one of the most common tools people have to view data

  • Choosing mobile app strategy depends on your approach: Browser vs native vs hybrid
  • Browser approaches looks at user using apps thru mobile web browsers
  • Native requires some of type of IOS to develop the app, and hybrid is a both browser and native 
  • Mobile GIS related to many other types of apps and frontiers: LBS, VGI, VR, AR
  • LBS (Location based service): Provide info based on user location
  • VGI (Volunteered Geographic Information): Things like Waze
  • VR (Virtual reality), & AR (Augmented reality)
  • ArcGIS Mobile Apps: Collector: Field data collection using GPS/maps, Survey123: Form-based surveys, Workforce: Assigns and tracks field tasks, Explorer & Navigator: Map viewing and navigation, AppStudio: Builds cross-platform native apps without coding
  • Tutorial 4 went over these topics and items: Designing a smart form on Survery123 and collecting Survery123 mobile app. Then using ArcGIS Quick Capture I made an editable layer  and configured a web map to view things like street cracks (wasn’t entirely sure at what the data was). And then lastly I prepared data to use for AuGeo, basically ArcGIS in AR, it was a bit weird using the camera to view things but I could easily see why this would be useful for visualizing things


For an application idea for chapter 4 I could make a mobile app about local tree health in a certain area.  I could use Survey123 and have users record location, species and condition of trees in a certain area directly from their mobile devices. The app would allow them to attaches photos and note any signs of damage or possibly disease if I want the app to focus on that approach, and then submit them in real time. This app could help city staff and groups track the health of a tree population and visualize patterns on a web map.


I think the app I will make for my final from chapter 1-4 will be a ArcGIS story map over local art museums in Columbus, Ohio. Would allow tourists or residents to look at where these art museums are, along with have a photo of what they look like and a description of what these museums hold.

Aiden Walz – Week 2

Aiden Walz – Week 2


Chapter 1:

Chapter 1 went over the basics and fundamental ideas of ArcGIS online.

  • WebGIS offers the ability to connect all over the world
  • WebGIS has a larger number of users and a low cost for them
  • Cross-platform capabilities with things like web apps
  • Easy to use and maintain 
  • WebGIS ideal for sharing information and can be used for vast array of applications
  • Mobile devices have become the de facto platform for accessing information online
  • WebGIS has five main types of content: Data published to Web Layers added to Web Maps & Scenes configured and used in Apps
  • Base components of a WebGIS app = Basemaps + Operational Layers + Tools
  • Data sources -> Feature Layers -> App
  • Many templates for layers, and apps
  • Played around with the various tutorials to get a sense of what WebGIS has to offer; First impressions are that WebGIS seems more user friendly than ArcGIS pro
  • Went through how all the various tab settings on the overview tab, and then on map viewer went through all the various tabs
  • Created instant app over the tutorial map


Chapter 2:

Chapter 2 went over the different types of web layers and what they do, and story maps.

  • Hosted feature layers created using CSV files and geocoding
  • Hosted feature layers are the most appropriate for visualizing data on top of basemaps
  • Hosted tile layers support fast map visualization
  • Using your own files on computer, an existing template, or empty feature layer can create a hosted feature layer
  • Smart mapping is a way for users to visually analyze & create high quality maps easily and quickly
  • Various types of smart mapping; like heat maps, symbol color and size, dot density, and many others
  • Smart mapping doesn’t just style your map but also does data analysis for you
  • Pop-ups are windows that show geographic information, lots of users rely on these pop-ups on maps for information
  • Can find lots of content and data on ArcGIS Living Atlas, contains all sorts of data
  • ArcGIS story maps allow for a web based story that combines interactive maps with things like text, video, or even photos
  • Tutorial 2 went over creating feature layer using geocoding, making a smart map based on that layer, creating pop-ups on ArcGIS arcade, and then creating a story around these items

One application idea based on chapters 1 and 2 could involve getting the location data of museums in Ohio, putting them on a feature layer, adding pop-ups with images, and then give a description of each museum along with an overall description of what this interactive map is trying to show you. It would be a great map for people in Ohio wanting to go to a museum and they could check how close one is using this map which would provide more information than something like google maps.

Walz – Week 1

Hi my name is Aiden, I am a junior pursuing a bachelors in biochemistry with a minor in environmental science. This was week 1 of Geog. 291 where I completed:

The syllabus quiz and scheduled an appointment with Professor Krygier.

Spent a few minutes just looking at where stuff was on my ArcGIS online account and then I read the section; Get Started: What Is ArcGIS Online. This section talked about how ArcGIS Online is a cloud based mapping and analysis site designed to create, analyze, share and manage geographical data. It can look at 2D and 3D visualization and work with other ArcGIS products.

I then did the ArcGIS Online Basics course. This course delved deeper into what ArcGIS online is. It really focused on the collaboration and sharing aspect of ArcGIS online. It then also talked about how these maps are set up; with base maps layers, uploading/downloading data, operational layers, and analyzing tools.

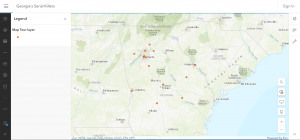
I then used google to look at an application online and found a map titled “Georgia’s Serial Killers” which went over the locations of where these serial killers in Georgia were caught. Though the map didn’t have a very good legend delving deeper into how/who was caught.

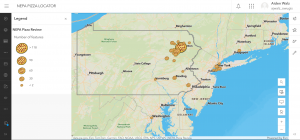
Another application was looking at some pizza chain uploading all of their locations onto ArcGIS online. They also seemed to have a bunch of other posts about using GIS and pizza, and I don’t quite have an opinion on that.