Katterhenrich Week 6

Chapter 7

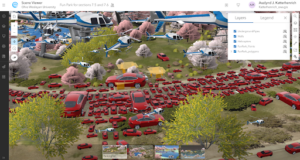
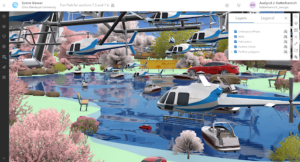
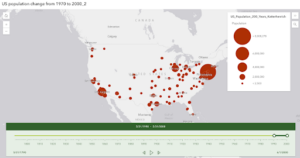
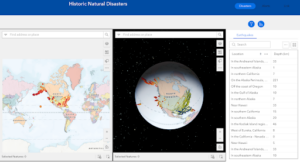
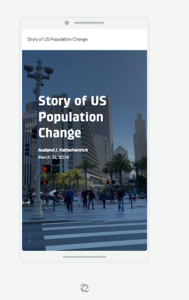
In this tutorial, I used a story map to explore scene viewers and different types of scene layers as well as a thematic scene map with a layer showing the USA population and population density. I like the 3D maps because it displays the data in an engaging and unique way. In the final couple of sections of this tutorial, I created a web scene of a park design using 3D symbols like cars, boats, planes, and trees. Using the elevation aspect was interesting because it allowed more variability in the placement of the features that were meant for the sky or underground. I was a little confused during this part because there were already symbols on the scene that I did not put there, but I later learned that the scene was public and there were symbols on there that other users had placed. I liked using the symbols in this tutorial so I think it would be cool to use this tool in my final project, it could be fun to recreate a scene somewhere in Delaware. 

Katterhenrich Week 5

Tutorial 6 

In this tutorial, I created another web map using real-time layers and made a dashboard based on this web map, I thought was cool because it displayed continuous data and even photos in real-time. In another section of this tutorial, I added a selector that allowed users to filter the dashboard so that it shows specific types of incidents based on any filters that were selected. I also was able to animate the time-series data in web maps and web apps. I found this part to be interesting because it displays the information and data in a way that is easily understood by users. I think I would like to utilize the real-time features from this tutorial in my final project, because of the engagement aspect of it. 


Katterhenrich Week 4

In the tutorial for chapter 3, I was able to create a 2D and 3D web experience using the Experience Builder in ArcGIS. The screenshot below shows the final webpage I created. The tutorial guided me through how to add many different widgets that all carried out different functions, it also showed me how to style these and edit actions and animations. I think it would be good to utilize the web experience builder tool from the chapter in my final project, I like how interactive it is.

In the tutorial for chapter 4, I used ArcOnline to design a survey and collected and viewed data using this survey. In another section of this tutorial, I learned how to create an editable feature layer with attributes and domains with attachments and templates, using this layer I was able to configure a web map. I also created an ArcGIS quick capture project using the layer I created previously and collected data.  This was not my favorite chapter but I can see how useful the survey might be if I decided I wanted to gather data myself for my final project. 

Katterhenrich Week 3

In the first chapter, I learned how to create layers from CSV files and add attachments to them, as well as how to add an ID field to a layer to display photos in organized sequences. I also learned how to add feature layers in Map Viewer and configure its style and pop-up.  This tutorial also taught me how to transform web maps into web apps using the attachment viewer template. I like how the app I ended up creating was user-friendly and accessible across platforms. 

In the second chapter tutorial, I learned how to create a feature layer from a CSV using geocoding, and how to configure layer styles on the visualization tab using smart mapping. I also learned how to use ArcGIS Arcade to configure layer pop-ups and how to add images and charts to these pop-ups. Finally, I created a story map and added swipe blocks and an express map

Katterhenrich Week 1

Hi, my name is Auzlynd, I am a junior majoring in environmental science and biology.

I already have an OWU ArcGIS Online account from taking the Geog 291 course earlier this semester. 

In the My Profile section, the projects I did in 291 are saved there. The training section shows courses you can take to gain skills in web mapping and analysis and The ArcGIS blog section shows what is new in ArcGIS Online with various other articles. 

From the reading “Get Started: What is ArcGIS Online” I learned that ArcGIS is a cloud-based mapping and analysis software with many uses like making maps and analyzing data. It also serves as a facilitator for sharing and collaborating. You can create maps, scenes, apps, and notebooks and manage the data you explore and analyze. This software can be used in field activities as well as configuring sites and provides tools for accessibility. 

The course “ArcGIS Online Basics” helped give me a solid foundational understanding of all the features of ArcOnline. I have attached some screenshots.

Using ChatGPT I looked up how hiking or camping could be applied in GIS. I learned that GIS can be used to make maps of trails used for hiking and these include useful information like difficulty, trail length, elevation gain, and points of interest. This is helpful so that hikers and backpackers can plan hikes and navigate trails. Here is a source I found that I thought was interesting: “Planning of recreational trails in protected areas: Application of regression tree analysis and geographic information systems” (Aleksandra M. Tomczyka, Marek Ewertowskia)