Veerjee Week 4
Within spatiotemporal data as well as real time GIS, there are several things to consider displaying. These are:
Moving: To show where things are going
Discrete: Show what is going on, good for semi random occurrences
Stationary: things that stay still, but have valuation shifts.
Change: Seeing how things change or grow.
I can also use these to display many or few things, and showing either specific points of time or the duration of time for events.
Tutorial 1: I immediately ran into a problem where I was unable to find the map that is likely required for the rest of the tutorials in this chapter. I am able to add a temporal layer by importing more data from the living atlas or finding it on my own.
Tutorial 2: To create a dashboard, i will want to click on “create dashboard”, add some tags, and bind it to a new folder. And it will essentially act as an individual app which will let me analyze what is going on if I were to view it independently. I can also add it onto my map / workspace. I can also set some different bounds based on like percentage points, different looks for the gauges, and different ways to make it look better. We can also display the different items being displayed on the gauge, the book decides to do the most recent incidents through an advanced formatting field.
Tutorial 3: For the 3rd tutorial it will be creating a category. These categories can be used to make different selections and things appear on the map. This will be in conjunction with other lists that can be made, this function can also be used to zoom into different areas of the map based on the category selections.
Tutorial 4: By using the methods of an Arcade feature, advanced formatting can be used. The arcade feature works similarly to a script, where various codes can be implemented in order to display things at a more advanced level than once otherwise done.
Tutorial 5: For the 5th tutorial, this is essentially finding a spreadsheet and uploading a timeseries data, and utilizes time zones in order to organize things properly. In this case, it is UTC-05 which is US Eastern Time.
Tutorial 6: For this tutorial, this is all about animating the population of various cities as time changes. I will want to use the options seen on the time slider to show the method of displaying population change over time.
Description of an application: Creating a dashboard that actively sees 311 incidents reported within Delaware County.
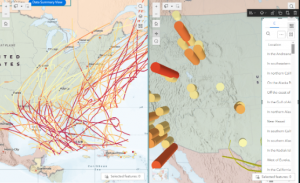
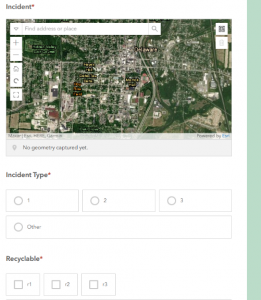
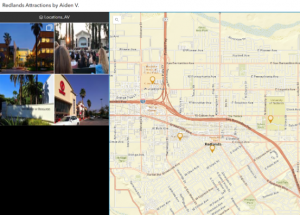
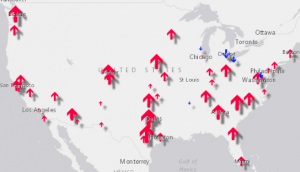 escription of an application of WebGIS using my data or that from Geog 291: