Askill Week 3

Chapter 3: This chapter was fun to complete to show the differences between 2-D and 3-D maps, specifically having them side by side. Doing simple GIS tasks also lets you learn about the world around you. I learned where the natural disasters happen around North America and actually on the GIS system, I learned how you can select certain points to view them easier. I was able to follow the instructions and pictures scattered throughout the chapter. 

Application: From chapter 3, I would like to create a 3-D map showing the world’s tallest buildings and where they are located. 

Chapter 4: Within these chapters, I have enjoyed working with different types of ArcGIS online systems. I really enjoyed making the survey. I didn’t know that was possible on GIS. This chapter is going to be really handy with regards to making maps of places and pin pointing certain locations and where they need to go. For example, making an amusement park map cellular would be a good example of a time to use this chapter’s learnings in. Also, simple paths can be made with a system like this to get from one place to another.  

Askill Week 2

Chapter 1: 

Chapter one starts off with a lot of background information from GIS and a lot of the common applications that are seen in GIS. It talks about the enhanced map database going from 2-D to 3-D. Sharing with groups and different organizations has become easier with ArcGIS online systems.  For the actual activity, it was easy to follow the book to determine what specific maps and pictures/symbols needed to be created. I learned how to create an app using GIS and online software. Instead of using dots to describe the different locations within Redlands, using the government icon makes seeing the different locations easier. Within the GIS field, you also learn about these different cities and areas within the book. The only question I had with chapter 1 was what all of the things the chapter told us to do means? More on the fact of why this is helping us develop a map. Going back and reading the intro paragraphs did help with this question. 


Chapter 2: 

Starting off with chapter two, I enjoyed seeing the different colors and types of maps under the sample smart-mapping styles. Over time, I would enjoy trying to make these types of maps. Doing the actual tutorial part of chapter two was a little more difficult than chapter one because there were a lot of minute details that mattered and could not be missed for any reason. The expressions were a bit confusing, but once I re-read the directions, it made sense as to what they were actually doing for the map. 

Applications:

One idea I had was mapping out wildlife sightings in a certain location or park. This would be a good idea to visualize where the animals were seen, and also could be used as a good educational tool for others to see. 

Askill Week 1

My name is Alida Askill and I am a junior majoring in Environmental Science and Zoology.  I have taken the first module of this course, but it’s been a few semesters. I have completed the quiz. Since I took GEOG 291, I am already familiar with my account. 

 Get Started: What Is ArcGIS Online

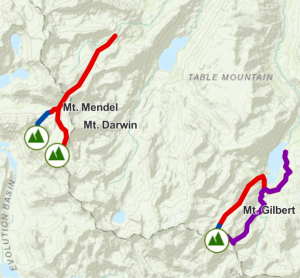
Comment 1: What really stuck out to me is that you can view time maps, and the website gives instructions on how to do that. It’s important to be able to see maps over a certain period of time to draw the correct conclusions for the experiment. I also kept scrolling down and the create map section is going to be very helpful because it lists the five steps on how to create a map. The basement is the first step, followed by layers, styles, pop-ups, then saving the map. 

Comment 2: 

I looked into what an Arcgis notebook is, and I think that might be helpful to compile data if there are multiple maps and charts to use and look at. You can also easily share notebooks. 

Web Course: ArcGIS Online Basics

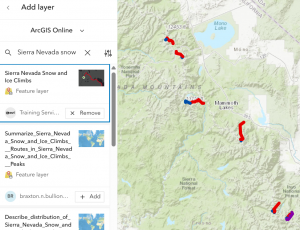
Comment 1: Layers, maps, scenes are all important to use in creating a map image. You need to know what layer to use when and for what specific type of map and project. 

Comment 2: The activities were helpful because it’s been a while since I have used GIS and have forgotten where some of the tools are. This is a beginner level course so it’s perfect for a walk through. 

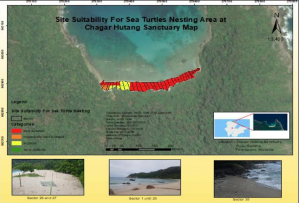
The first source I found is about sea turtle nests on a coast and where they can nest. The source is called Site Suitability Analysis for Sea Turtle Nesting Area by using AHP and GIS. Temperature of the sand, vegetation cover, beach slope, and sand particle size are all important factors in where sea turtles can make their nests on the Malaysia beaches. GIS can determine all of these factors. 10.1088/1755-1315/1217/1/01203

The second source I found is about the artificial reefs and beach restoration happening in Martin County, Florida. GIS is used heavily in ideas like this because it’s really easy to go back in time to see old maps and compare the habitat destruction to see how humans have the ability to now try and rebuild that habitat. Sea turtle populations are diminishing across the world and one of the factors to talk about is the fact that their nests are being disturbed by dogs and beaches are being destroyed. This makes hatching nests hard and reproduction even more so. https://www.fsbpa.com/2014TechPresentations/Carvalho.pdf