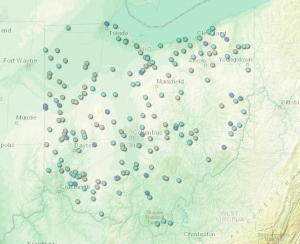
For my final, I made a map tracking tornado locations in Ohio over the past 5 years. I mapped this out to see if there are any areas where tornadoes are more likely to occur than others. Based on the original map (where I did not add elevation profiles) you can’t really tell which areas are more likely than others. Once I added the elevation profiles, it was very easy to tell why tornadoes do not occur as often within certain regions of the state. https://arcg.is/0nr0Tv1
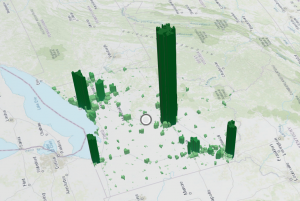
For my second application, I created a map showing population distribution across Ohio. The map shows which areas are more populated than others; the more populated areas are also represented by having a higher elevation, making them easier to see. As you can see, the more dense areas are those which are in close proximity to large cities, such as Cleveland, Toledo, Cincinnati, and Columbus. https://arcg.is/1vSrOi3