This week in chapters 1 and 2, I created a Web GIS app that introduces the main attractions or points of interest (POIs) in the city of Redlands, California. I also gained more experience creating story maps and learning about the things that they have to offer.
Chapter 1:
- I created a new item and uploaded the cvs file from the chapter 1 data I downloaded.
- I learned how to add new layers and added one with the attachments for this chapter. I then added an ID field to the layer.
- I also learned how to share layers with the public.
- I familiarized myself with editing and changing symbols used to identify different map features.
- I learned how to configure pop ups and attach different contents to them.
- After creating the web map, I created an instant app using the web map. I remember creating an instant app in GEOG291, but I did not quite remember it and was unfamiliar with how the process worked.
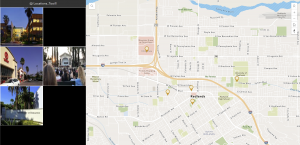
- I added the desired attachments, changed the basemap layer to more accurately and clearly show surrounding features, and published my app to the public for everyone to view it. I did have some trouble initially creating the instant app because I could not get the attachments to stick. The tutorial instructions threw me for a loop because they were outdated and did not show the exact steps to get to where I needed to be. It took me some extra time, but I finally figured it out well enough to get the attachments placed.
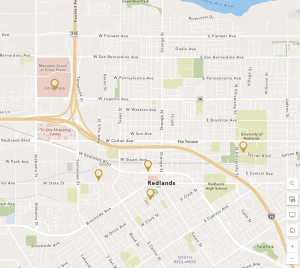
- The point of this particular application was to show different attractions in the Redlands location, namely the University of Redlands, Esri’s headquarters, Citrus Plaza, and LOOK Cinemas. The instant app shows the location of these places but also includes general information about them as well.
Chapter 2:
- I downloaded the cvs file for Chapter 2 that includes the following data: Rank, city, state, census 2010 and 2020, estimates for 2012, 2014, 2016, and 2019, median household income for 2019 and 2021, median home value in 2019 and 2021, Wikipedia pages for the cities, and pictures of the cities’ seals or flags.
- I followed a lot of the same steps that I followed for the tutorial in Chapter 1.
- I configured more popups with images and then created a story map.
- Like the apps, I remembered making a story map in GEOG291, but I didn’t entirely remember everything, and I think that this tutorial went much deeper into what you can do with story maps than what we did in GEOG291.
- In this tutorial, I added maps, media (a video, could add others though), and map actions. The map actions were confusing because the tutorial instructions were outdated for this part. There was no map action option to choose, instead it was media action plus a few more steps. It took me a while, but I was finally able to get map actions created to show Denver and Detroit specifically.
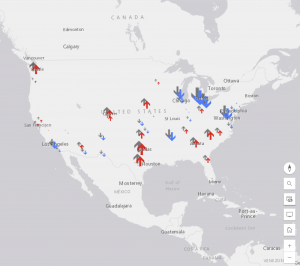
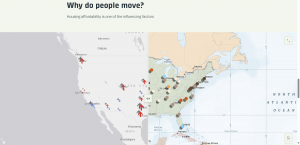
- Then, I added a side car that allowed me to display a 3D web scene of the population changes. Afte that, I added arrows to show movement relationships between states, specifically between California and Texas, and New York and North Carolina. This part kind of felt not related to the rest of the content, but it was good to learn, nonetheless.
- I also added swipe blocks that were able to show change over time in populations from the two maps that I added. It showed these changes by allowing me to slide a bar that enlarged and shrunk the maps I was looking at.
- The story map did not look great initially, but once in preview mode, it actually looked kind of professional and seems to be a great way to display information.
An application that could be made using the information from these chapters and tutorials is a story map that discusses change over time in population of a specific species. Geographic data can be gathered on the current population and mapped out using web GIS. Previous geographic data can be found on the species if they have been well studied before. The story map would include information on the species and an interactive swipe block that can show the two different maps (past and present) to allow viewers to see the change in population number and locations.