Chapter 6:
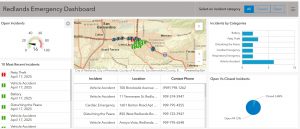
This chapter was interesting, and I enjoyed creating the Redlands Emergency Dashboard. It focused on spatiotemporal data and real-time GIS, two things I had not heard of before. The introduction was a great way to move into the tutorials and made everything easier to understand. It was interesting to see how you can get real time data, such as emergency calls and highway camera pictures. I can see how something like this system could be very beneficial for communities to track crime and see which areas could be underserved. I had a few problems with tutorials 6.4 and 6.6 because some of the buttons were hard to find. Overall, I enjoyed this chapter and learned more important aspects of the dashboard feature.
An application from this chapter on other data could be used for weather. Temperature gauges around the city of Delaware could relay the most up-to-date temperatures to the dashboard. This would allow people to dress or prepare accordingly to a more accurate temperature than their phone.