Ch. 3: The map portion of this chapter went very well and I was able to easily create the maps needed. I can see how this would be useful in displaying all sorts of data. However, I had several issues with the data summary portion. First of all, I found out that using the link given in the tutorial does not work on a MacBook, so I had to go to the link in my browser, download the image, and upload it manually. Secondly, the views navigation widget would not work, which might be why I could not get the dynamic content widget to work later on, even though I made sure I was following the instructions.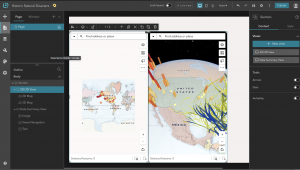
Ch. 4: I had several issues with this chapter as well, most notably that the URL that had our data for the chapter would not load when I typed it into my browser. I skipped the first and second tutorials because I could not obtain the data for them, though I was able to get the gist of it from reading the instructions. On the third tutorial, I noticed that a number of the instructions did not exactly line up with the website. I assume this is because the book was made in 2022 and the website has been updated since then. Because the website is similar enough to how it must have been when the book was published, I was still able to do these tutorials. This part of the book was really useful for getting some experience in using some of the apps ArcGIS has to offer.
I think that an interesting way of implementing what we learned in these chapters would be to make a map of forest density across the U.S.. The data could be displayed similar to how it was in the tutorial for the chapter 3 map, though in the case of the 3D map the entire region would need to be a raised data point as opposed to the skinny data ‘poles’ used to describe the buildings and their height.