Stephens Week 3

Chapter 3:

SO experience builder just kind of modifies and combines apps and widgets? I like how it interconnects

Please don’t make me use the developer one my computer is crying

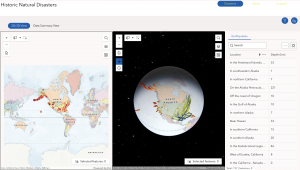
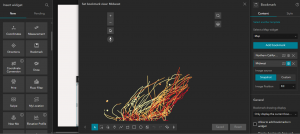
I kind of feel like I’m making an overcomplicated powerpoint again.. Therefore I chose spin animation instead of zoom in.

I put the maps next to each other as I modified the 3D one, so they would be easier to see. Also had some trouble getting it to snap to the corners so I just dragged the maps. Another thing that helped me that the book didn’t mention is being able to select widgets. I added a fade in effect to the image in the data summary and it looked pretty cool in the live view. I kind of wish it would select the hurricane or earthquake on the 3d map instead of just hiding everything else.

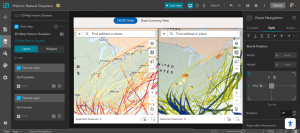
I also adjusted the colors and font in data view to make it look fancy, and I tried to find a way to center the text better but the centering options i could see just moved the text box.

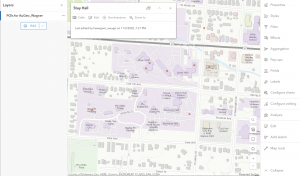
I was very confused at the table part because there was no blank spot, but it turned out the page was wider and I wasn’t zoomed out. I had another issue earlier with the dynamic content where I struggled to find the pane because it popped up hidden in a corner. Are there some weird presets?

The filters and SQL expressions were also a lot like desktop

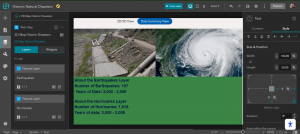
When it was time to embed the link, I had to paste it into my browser and copy that link because it didn’t accept the shortened one. That’ll be important to remember. Here’s the final product for chapter 3.

https://arcg.is/ienWi

CHapter 4:

For my project I think it would be so cool to actually go to metro parks and take my own pictures, and attach them to a map to make my own feature layer. Enabling public attachments would also be a nice way to make it an interactive and collaborative web experience.

Starting on Survey123 and it’s ok so far. I think the imagery with labels basemap will be perfect for my metro parks project

Site kept glitching out and zooming back out to the whole world when I tried to go to Delaware. Eventually I had to refresh it a bunch and allow it to get my location through my computer.

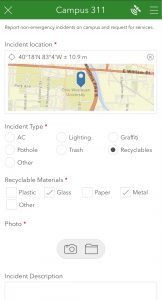
I had to add the rule for showing the recyclable categories in a completely different way than the tutorial said. When I opened the survey on my phone and selected recyclables, the type question came up so I guess whatever I did did the trick!

When I started making my own layer and adding fields I noticed that the tutorial had the wrong order to do things in. Choosing the type (integer) is before naming the layer. I think the website has been updated a bit since the book was put out.

https://arcg.is/TDueK0

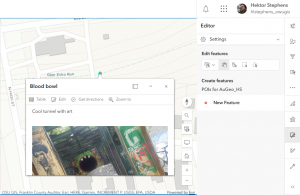
The quick capture project was pretty simple to put together and I think I could make something with that for my project. It wouod be a great tool for recording locations and capturing pictures of invasive plants, and maybe i could attach it to a second app that gives a rundown on identifying them for people without a botanical background. Adding images to the forms might help too.

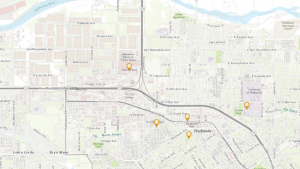
For the AuGeo app, I’ll test that later because I picked a couple places in Columbus, but here’s one of them. I’ll make a note to add them to next week’s post.


Wagner Week 3

In chapter 3, I learned about ArcGIS Experience Builder. I learned the basics of experience builder and some of its key features. The web apps that are created using the experience builder are called web experiences. After learning about the basics, I started tutorial 3 to create a web experience that displays data about historical earthquakes and hurricanes. First I created a 2D and 3D integrated web experience. There were a few steps that I had to google where the buttons were but other than that, it went smoothly. Next, I configured map message actions. Then I configured dynamic content, the table widget, and the filter and chart widgets. Last, I added two pages. When I was adding the link to the second page, it said it only supports HTTPS so it wouldn’t work. I just moved on. Overall, I enjoyed this tutorial and I see how this type of app can really help show data and make connections.

Chapter 4 was all about mobile GIS. I learned about the concepts and advantages of mobile GIS such as mobility and ease of data collection. I also learned about field maps which allows users to display web maps, search for places and features, such as assets or areas of study, and be directed to them. In tutorial 4, I learned to use Survey123, Field Maps, QuickCapture, and AuGeo. While doing 4.1 and adding a map, I couldn’t find the imagery hybrid basemap. I also could not figure out how to set the rule for step 14. In the end, the survey still worked fine. In 4.3 I couldn’t find the create a list button for step 15 and so I wasn’t able to complete the rest of the tutorial. This created a problem for the next several tutorials but I am still going to try and figure them out. It was interesting to download and use the apps on my phone when I had no idea GIS could connect to things like that. I thought AuGeo was a cool project as well.

An application I could create would use experience builder to show crimes in a specific area. I could have the 2D and 3D maps and show data that shows the different types and amount of crimes. I could add other pages with additional information about the location and maybe a website with resources on how to report a crime or stay safe. 

Baer – Week 3

Chapter 3

Chapter three show how to use apps to show how data changes over time. It also showed a various amounts of widgets that make map making that much easier. I really liked looking at this part. Maps that have a slider always seem so cool to me. I also think it is a great way to share scientific/technical findings with everyday citizens who may not know how to read maps. These maps combined with story maps are the perfect combo.

One application for this could be showing the growth of urban developement by a river and how the river changes over time.

Chapter 4

In this chapter, we looked at mobile GIS. I thought this part was really cool. I want to do field research someday, and the idea of being about to plot study sites on the go rather than having to sit down at a desktop was really cool. I think some of the VGI features were really cool too!

An application for this chapter could be used to determine animal sightings for hunters or conservationists. Another one I thought was funny was to use it to see where the police sit on the road the most to avoid a ticket. But that’s a joke.

Kozak Week 2

Chapter 1

Chapter 1 is used to introduce ArcGIS online and ArcGIS Enterprise and the basic operations of the program. Web GIS uses web technologies to allow people to interact globally and access information instantly. Some of the advantages of Web GIS are global reach, large numbers of users, low cost per user, better cross-platform capabilities, easy usage, and easy maintenance. There are five main content types available with Web GIS including data, layers, web maps and scenes, tools, and maps. There are three main components that make up a Web GIS map and they include the basemaps, the operational layers, and the tools.

Chapter 2

Chapter 2 is about smart mapping and storytelling. Stories are the most popular type of web apps. This chapter talks about the different types of hosted layers, including hosted feature layers, hosted WFS layers, hosted tile layers, hosted vector tile layers, hosted WMTS layers, hosted scene layers, hosted image layers, and hosted map image layers. There are several different ways to publish hosted layers including creating a feature layer from your own data, creating a feature layer from an existing template, and creating an empty feature layer and defining your own fields. This chapter also talks about smart mapping which enables people to analyze, create, and share maps quickly. Smart mapping can also perform exploratory data analysis which helps people understand potentially hidden patterns. Pop ups are used to show geographic data and insight. A good WebGIS app is fast, easy, and fun for the user. An ArcGIS story tells the who, what, when, where, and why. It uses a combination of maps, narrative, and multimedia to create a story. 

One potential application would be to create a map of the most popular ski mountains in NH. The map would display location as well as information like mountain height, average number of visitors per year, and mileage of ski trails. The information would also include images of the ski mountain or logo to help familiarize the audience.

Dondero – Week 3

Chapter 3:

  • Web apps allow you to create interactive maps, with objects such as sliders to show how data changes over time, and searches to select specific pieces of data.
  • You can use the web app builder to create or modify existing webapps, and use widgets to quickly add features and functionalities to your map that weren’t previously available.
  • Chart widgets allow you to display data visualizations beyond just the spatial methods provided by the map.
  • Filter and query widgets allow you to parse through the data more efficiently, in order to find the information relevant to your project.

One idea for a web application that could be made using this information would be a map with a timeline showing how the highway system in Ohio has grown over time. Charts could be used to show growth numbers year by year, and a filter widget could be used to select only data from, for example, northeast or central or southern Ohio


Chapter 4:

  • Chapter 4 discusses mobile GIS, which has several advantages over traditional desktop based GIS.
  • Some of these advantages include the ability to work in areas where it would be infeasible for traditional GIS to operate, the inherent benefits of using a device outfitted with GPS capabilities to collect spatial data, while some of the disadvantages include reduced processing ability, as well as cellular coverage and battery range limitations.
  • Mobile GIS also has several unique application types, including VGI, which includes user submitted information like police activity or road accidents, and AR, which overlays additional data onto the world through the mobile device.
  • Creating feature layers for Mobile GIS is unique because of the added ability for users to append, update and delete data from their device.
  • Additional data infrastructure such as surveys can be integrated into your applications as well, allowing for user input collection.
  • Many options exist for data collection, with varying levels of ease of use vs capabilities of the app.


One idea for a mobile GIS application would be an application that would allow users to submit animal sightings at their location, which could be useful for determining rough estimations of populations present in a certain area, if enough people used the application.