Chapter 7 is about 3D scenes and how this is accomplished via extended reality systems such as VR, AR, and MR. Maps that use 3D scenes can be realistic or cartographic. 3D scenes have a few main elements including surfaces, features, textures, and atmospheric effects. 3D scenes can also have textured or untextured layers to visualize complex digital models which typically has an overview, discipline, category layer, filter, integrated mesh scene layer, point cloud scene layers, point scene layers, and volex scene layers. This technology can be used for many things such as building metaverses and urban planning.
Month: November 2025
Conti – Week 4
Chapter 5 focuses on ArcGIS Enterprise and specifically on-premesis Web GIS. People may choose to use ArcGIS Enterprise instead of ArcGIS Online because Enterprise runs on user-managed infrastructures and is typically used if on-premesis GIS, hybrid GIS, or functionalities only available on ArcGIS Enterprise are needed. ArcGIS Enterprise includes a portal for ArcGIS, an ArcGIS server, ArcGIS web adaptor, and an ArcGIS data store. All of these aspects work together to create effective software.
Chapter 6 is all about spatiotemporal data and real time GIS. Spatiotemporal data is categorized as moving, discrete, stationary, or change. This is important to real time GIS because it is a way to provide better situational awareness, enhance emergency response, and support better decision making. This chapter also talks about the Internet of Things (IoT) which is the network of physical objects embedded with sensors and network connectivity that allow the physical objects to collect and exchange data. This data can be understood as intelligence which, with geolocation context, can be acted on. The IoT can be applied as a smart city or a smart home. Chapter 6 also discusses ArcGIS Velocity and ArcGIS GeoEvent Server. Both softwares interact with various data sources and translate different data formats, filters and analyzes data in real time, and sends processed data to external sources.
Conti – Week 3
Chapter 3 focuses on ArcGIS experience builder which allows a person to create experiences on the web using a flexible layout, content, and widgets that interact with different kinds of data (both 2D and 3D). Widgets come in two types: Basic Widgets and Layout Widgets. Basic widgets function as app tools, while Layout widgets are containers that help organize other widgets on a person’s pages or windows. Widgets are also able to talk with each other using message actions or data actions. Message actions perform automatically when given a trigger, while data actions need the user to tell it what to do. Message actions are made up of the triggers, the targets, and the actions which can all work together to create dynamic content.
Chapter 4 is all about mobile GIS which is GIS on mobile devices. Mobile GIS has some advantages such as a large volume of users, mobility, versatile means of communication, ease of data collection, location awareness, and near real time information. There are also some disadvantages that come with the use of mobile devices such as limited memory, limited CPU speed, bandwidth and network connection, screen size, keyboard size, and battery power of the mobile device. There are different types of ways a person can develop apps on a mobile device including the browser based approach, native based approach, or the hybrid based approach. Browser based is less costly and generally more accessible, but does not always perform well, while native based is more expensive, requires more knowledge of mobile software, but generally performs much better. Hybrid based is a mix of both browser and native. This chapter also discusses ArcGIS Fieldmaps which is a combination of many other ArcGIS products and can be used to help plan, track, and understand data as well as help with the process of capturing data of field workflow. Fieldmaps can utilize many different apps and technologies such as AR and VR in its creation of an interactive map.
Conti – Week 2
Chapter 1 functions to introduce ArcGIS online and the basic ways to use ArcGIS Enterprise. This system allows people to use the web in order to access information concerning almost anything. This system makes information instantly available for people from anywhere in the world. Web GIS is low cost, simple maintenance, easy to use, and good cross-platform capabilities. The different content layers of WebGIS include web maps and scenes, data layers, tools, and maps. The three layers of creating a WebGIS map are basemaps, operational layers, and tools.
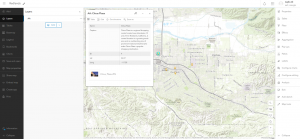
Chapter 2 focuses on mapping and storytelling The chapter delves into different hosted layers including tile layers, feature layers, WFS layers, hosted WMTS layers, and many others. The chapter discusses the many different ways to publish a layer such as creating the layer from a template, creating it from your own data, and creating a layer in which you define your own fields. The chapter also talks about smart mapping. This is a process that allows people to create, share, and analyze maps quickly. Analyzing the map could show patterns that a person might not have been able to catch themselves. The chapter lays out the traits of successful storytelling with ArcGIS and mapping. A successful story tells who, what, when, where, why, and uses multiple forms of media to tell a story. Making maps visually appealing and interactive in this way not only to make a map look pretty, but also to make the map easier to understand and analyze.
Saeler week 2
Chapter 1
- This chapter introduces basic concepts and workflows of web gis and the esri geospatial cloud. Beginning with an overview of web gis and lists the technical evolutions in web gis and explains its content types, hosted feature layers, app types, and user types in web gis. Then going onto demonstrate the workflow to build web gis apps using the attachment viewer instant app template.
- Starting with publishing a hosted feature layer from a csv file and adding attachmetns; to adding a field to the layer and editting the attributes; then creating a web map; and finishing with creating an instant web app using a template.
Chapter 2
- web layers are important because they are the building blocks of web apps which are important because they are the faces of web gis. Stories being more popular. Continuing the discussion of feature layers and web apps particularly arc gis webmaps. This chapter introduces feature layers and the various ways you may style them using smart mapping and discussing living atlas of the world. as well as further exploring storytelling using gis.
- Tutorial- starting with creating a feature layer using geocoding, then configuring layer style using smart mapping, proceeding to configure layer popups using gis arcade, then adding images and charts to layer popups, finishing up with creating a story and working with swipe blocks and express maps.
Hess – Week 5
Chapter 7:
Chapter 7 focusses heavily on 3D mapping and web scenes. Some of the main takeaways include gaining a general understanding of what web scenes are and the terminology associated with them, learning about different scene layers ad the features used to build them, and creating web scenes with tools like Scene Viewer. The chapter Aldo covers concepts such as 3D visualization, the metaverse, AEC (Architecture, Engineering, and Construction), and the broader value of GIS, as well as how to create and use feature layer that contain z-values. Overall, these topics provide a solid foundation for understanding how 3D maps work, which is more complex than creating standard 2D maps.
My application for this is making a map of mosquito West Nile virus cases in Ohio by county, but having the counties rise up (z plane) base on the amount of cases.
Hess – Week 4
Chapter 5:
This chapter focuses on the Hybrid GIS system, a hybrid GIS system combines multiple deployment models; desktop, web, and cloud GIS, and integrates the strongest features of each. The chapter also covers raster and vector tiles. Raster tiles divide a map into image segments that’s can be reassembled after being transmitted, while vector tiles package geographic features into grouped vector data files, often delivered in the Protocol buffer Binary Format (PBF).
Chapter 6:
This chapter explains spatiotemporal data and real-time GIS. Spatiotemporal data comes from many sources, ranging from manually collected data to information gathered from sensors or generated by models. Real-time GIS involves data that is captured and processed either at a single moment or continuously over a period of time. Spatiotemporal data falls into 4 categories: moving, discrete, stationary, and change-based. The chapter also introduces the internet of things (IoT), describing it as a network of everyday physical objects equipped with sensors and connectivity that allow them to collect and exchange data. Examples include taxis, bicycles, refrigerators, biochips, and security cameras. Today, IoT consists of billions of sensors, and its overall market value is much more than we can estimate it to be.
My potential application of these concepts would be a GIS baes Census for all of Pennsylvania to track Elk Populations as they start to move back into Pennsylvania.
Asp – Week 5
Chapter 7 introduced me to 3D visualization and how it can transform spatial data into immersive and interactive environments. I was very interested in how scene viewer allows users to convert basic 2D GIS data into 3D scenes with points, many types of polygons, in the sky and undergound features. Chapter 7 made it very clear to me that 3D GIS doesn’t only just make maps look more appealing but it also helps people explain spatial relationships such as underground utilites, building heights, sunlight and shadow changes throughout the day.
One of the most interesting parts of the reading to me was when it talked about VR, XR and also MR technologies how these overlap in the theory of the metaverse. The idea that GIS data can help construct real looking 3D worlds whether it’s for gaming, urban planning or emergency training this shows how geography and virtual design are becoming more secure than ever. I also thought the ArcGIS indoors and ArcGIS urban was very cool. Having these tools to use for 3D mapping can help us go beyond just outdoor areas and shift into interior spaces and city planning.
Application: Using the information from chapter 7 I could create a 3D web scene of the Ohio Wesleyan University campus. I tried to make my map look good but this was the best I could do unfortunately. My map isn’t good at all compared to others but I added different types of trees to the campus of OWU.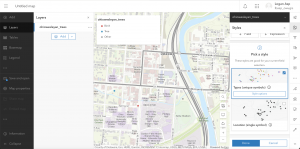
Datta – Week 5
CHAP 7: 3D WEB SCENES
3D is easier to navigate than 2D bc the real world is 3D (woah never wouldve guessed)
3D can be photorealistic or cartographic
Divided into surfaces (elevation), features (things on the elevation), and atmosphere
Feature layers can show different objects such as benches
Building scene layer: allows for scenes of buildings
Discipline and Category exist but I don’t entirely understand what they are
Filters allow you to view only specific parts of the scene
Integrated Mesh layers use drone data to make a mesh of the scene
Pointed maps are like those LIDAR scans (which my only experience with LIDAR is with horror games so. bleh.)
Voxel scenes add temperature into the mix of 3D scenes
For city planning ArcGIS CityEngine is used to build cities and has been used in movies
3D scenes can be used in VR and AR
3D GIS can be used in indoor planning or in urban planning
Application: i imagine it’s more efficient to model a city in ArcGIS than in blender, so you could make a city, or if you aren’t going to do that, a building or a room
Inderhees- Week 5
Chapter 7
This chapter focuses on the concept and application of 3D web scenes, positioning them as an advanced and highly beneficial evolution of traditional 2D mapping, offering major advantages in data visualization, analysis, and communication by making it quicker and easier to understand the size and relative positions of objects in fields like urban planning, architectural design, defense simulation, and filmmaking. The chapter identifies two main scene types: Photorealistic, which uses imagery to re-create visible reality, and Cartographic, which applies 2D mapping techniques in 3D. notes that scenes can be displayed in two view modes: Local mode or Global mode. Key elements comprising a 3D web scene include Surfaces; DTM and DSM, Features; operational layers, Textures, and Atmospheric effects, while layers such as integrated mesh and intriguing point cloud layers are used for detailed data representation and visualization. The structure of complex scenes like building scene layers is detailed by components such as category and discipline layers, and critical to this advanced mapping is handling vertical space using z-values and Z layers to address challenges like mapping multi-floor buildings. This chapter highlights the collaboration between GIS data and immersive technologies like VR, XR, and the Metaverse, which allows users to interact with maps and gain a first-person perspective, with the overall process involving a six-step workflow from choosing the mode and base map to adding, configuring, and saving the layers.