Stratton- Week 4

Chapter 5-

This chapter starts by explaining the different organizations and components within Web GIS, on top of Esri and how some organizations must have ArcGIS Enterprise to function. This may be due to the lack of internet connection or restriction of connection, if an organization wants to keep their layers within their infrastructure while using online content, or if they want to use functions that are only available through ArcGIS Enterprise. It then defines ArcGIS Enterprise as “an on-premises, user-managed component of the Esri geospatial cloud” or basically a variation of ArcGIS Online with some specific differences. There are multiple components of this. There is Portal for ArcGIS, which is a content management system and can create hosted layers, create web maps and scenes, create host web mapping apps, search for GIS content in an organization, secure access to GIS content, and manage organization utility services. The ArcGIS Server allows the information to be available to other people in the organization or chosen, anyone with internet. Roles of this include, GIS server, Image server, GeoEvent server, GeoAnalytics server, Business Analyst server, ArcGIS knowledge, Notebook server, and Workflow Manager server. The ArcGIS Web Adaptor integrates the Enterprise into the organizations’ web server and security. Lastly, ArcGIS data store makes data available for storage. The chapter then details how to deploy Base ArcGIS Enterprise and the different deployment methods/scenarios.

Chapter 6-

Chapter 6 details how to use spatiotemporal data and real-time updating GIS. I think that it’s amazing that these maps and experiences can update data as needed. There’s different categories of these spatiotemporal data, Moving (like live feeds of vehicles) is basically something that moves, Discrete (like natural disasters) is basically something that “just happens”, Stationary (like highway speed or water levels) is something that stands still but changes as well, and Change (like land use) is just change and growth. These could be at a point in time or over a duration of time. While using spatiotemporal data, you encounter IoT. It’s a network of physical things that are embedded with sensors and network connection that collect data. These are found in a lot of devices like taxis or even sprinklers. There are billions of sensors modernly. Smart homes and smart cities are really helpful to this practice, as they are filled with smart devices that include these IoTs. I find it so interesting that you can use these data sets to animate a map, and create a moving interactive experience for users to convey your mission and findings. This seems to be really helpful to track important things like traffic patterns, population sizes, or natural disaster locations and frequency. This tool is my favorite out of all the functions of ArcGIS online.

Stratton- Week 3

Chapter 3-

Chapter 3 overviews the experience builder aspect of Web GIS. I learned that the experience builder tool is extremely helpful to create interactive maps and present data in more unique ways than the traditional map. To use the experience builder, there six steps. Pick a premade template or create your own, then select a theme, add source data, add and configure widgets, refine layouts for all devices, then finally save, preview and publish. It was really cool to me that you can make your experience have multiple pages, and interactive widgets that further help convey your data. There are two types of widgets, message actions (which perform actions automatically in response to triggers), and data actions (which users can use to perform actions). For more detail, Message actions have three components, triggers, targets, and actions. Triggers are events generated by the widget, targets perform actions in response to the trigger, and the actions are the specifics of what it performs. The tutorial was honestly confusing for me to follow and I had a hard time navigating the experience builder software but I eventually figured it out after a lot of time and struggle. I stopped struggling after 3.3, but after that it was just very time consuming for me.


Chapter 4-

Chapter 4 is about mobile GIS. It explained the advantages of mobile GIS, which include the following; mobility, location awareness, ease of data collection, near-real-time information, large volume of users, and versatile means of communication. The mobile GIS is built on mobile devices, mobile operating systems, wireless communication technology, and positioning technology. It also explains that although being mobile is a huge advantage, it’s also held back by mobile devices being limited due to their low CPU speed, memory size, battery power, network connections, screen and keyboard size. There are a number of strategies when developing a mobile app. A browser based approach uses HTML, JavaScript, and CSS, and can potentially reach all mobile platforms. These apps are usually cheaper and faster to make. Next the native based approach are apps that are downloaded onto the mobile device and require native developments skills, they have deep access to hardware and performs better than browser apps but are very expensive. Lastly the hybrid based approach integrates native components with native apps (This part didn’t make sense to me). These can be used for field maps and indoor operations which I find very cool and interesting. You can carry out surveys with this feature which is extremely helpful and gives a useful tool for people.
Wagner Final

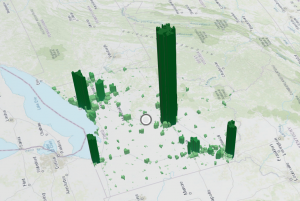
For my first application I created a 3D web scene that shows the population by county in Ohio in 2019. You can clearly see where the largest parts of Ohio population resides and it makes sense when looking at the biggest cities and most popular counties. 

https://arcg.is/04iLPf0


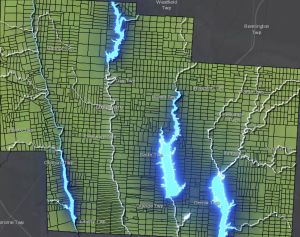
For my second application I created a 2D and 3D integrated web experience using  data for population and GDP by county in Ohio. If you click on the counties in the 2D map, it will isolate those places in the 3D map to show you the specific 3D data. I also added a separate section with the table and a picture of the counties with labels if someone just wanted to look at all the individual data tables. For some reason on the second section with  the data summary the picture of the counties is cut off on the final published experience but it doesn’t look like that when I try to edit it. 

https://experience.arcgis.com/experience/a294a97834a5442b86708aa6e9053280


Fox Final

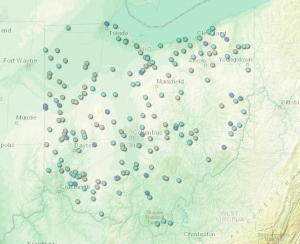
For my final, I made a map tracking tornado locations in Ohio over the past 5 years. I mapped this out to see if there are any areas where tornadoes are more likely to occur than others. Based on the original map (where I did not add elevation profiles) you can’t really tell which areas are more likely than others. Once I added the elevation profiles, it was very easy to tell why tornadoes do not occur as often within certain regions of the state. https://arcg.is/0nr0Tv1

For my second application, I created a map showing population distribution across Ohio. The map shows which areas are more populated than others; the more populated areas are also represented by having a higher elevation, making them easier to see. As you can see, the more dense areas are those which are in close proximity to large cities, such as Cleveland, Toledo, Cincinnati, and Columbus. https://arcg.is/1vSrOi3

Massaro Final

For my final, I created two Web Apps.

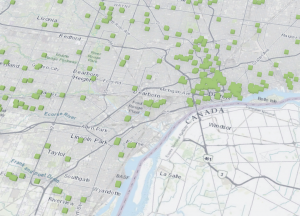
This first web app was created using Experience Builder. It displays different dog parks in the Columbus area and their ratings. In the app, you can view a pop-up menu that displays the locations. You can click on the locations to zoom into them. You can also filter out lower-rated dog park locations.

https://experience.arcgis.com/experience/9dbde9cde76a421ea6fb2002cc3bb57e

The second web app I created was through Instant Apps. I this app, you can see wildfires displayed throughout the US. You can search for specific locations on the map. In addition to this, using the swipe feature, you can view areas that are critical habitats for endangered species. You can use the swipe feature to compare the wildfires and the habitat locations to determine how the fires could be impacting endangered species populations.

https://owugis.maps.arcgis.com/apps/instant/basic/index.html?appid=3cca7e943ff0444d963574bb47f6d034

Duncan- Week 5

Chapter 7: This chapter is all about 3D web scenes. This is something that really interests me as 3D models are particularly exciting to me. As the book says, we do live in a 3D world so being able to map things in 3D is crucial to fully understanding an area. This chapter teaches us the basics of 3D GIS, it also explains the benefits that we gain from making our maps 3D as we have more accurate details, and more intuitive analysis of the maps we make. With 3D maps you get a new facet of the maps, we have always had features and textures, but with 3D GIS we also have atmospheric effects. Which would be things like fog and cloud cover, as well as certain types of lighting effects. Scene layers allow you to visualize complex digital models and it allows you to interact with the buildings are have those layers applied, which in my eyes is really cool.  A 3D building scene is another thing this chapter explains as it gives us the steps and the structure to follow. those steps include an overview, this is the layer that allows you to view a 3D building as a single layer, and it can be created by an exterior shell which would be made by using the building layer. Then, you have discipline, which combines the category layers into various disciplines off a building. Then you have Category layers, which represent individual categories. followed by Filter, which allows you to view details in complex buildings and you can choose to only show certain elements of the attributes selected. Then you have the integrated mesh scene layers, which are constructed by large sets of overlapping imagery. After that you have the point cloud scene layers which are described as the layers that provide a fast display of large volumes of symbolized point cloud data. Then theres the point scene layers whih are used to ensure a fast visualization in all clients and they use a cached point scene layers used to display large amounts of point data. Finally you have voxel scene layers, which are the layers that represent multidimensional, spatial, and temporal information.

Potential Application- Making a 3D landscape of buildings within the Delaware area and how long they have been there.

Conti – Week 5

Chapter 7 is about 3D scenes and how this is accomplished via extended reality systems such as VR, AR, and MR. Maps that use 3D scenes can be realistic or cartographic. 3D scenes have a few main elements including surfaces, features, textures, and atmospheric effects. 3D scenes can also have textured or untextured layers to visualize complex digital models which typically has an overview, discipline, category layer, filter, integrated mesh scene layer, point cloud scene layers, point scene layers, and volex scene layers. This technology can be used for many things such as building metaverses and urban planning.

Conti – Week 4

Chapter 5 focuses on ArcGIS Enterprise and specifically on-premesis Web GIS. People may choose to use ArcGIS Enterprise instead of ArcGIS Online because Enterprise runs on user-managed infrastructures and is typically used if on-premesis GIS, hybrid GIS, or functionalities only available on ArcGIS Enterprise are needed. ArcGIS Enterprise includes a portal for ArcGIS, an ArcGIS server, ArcGIS web adaptor, and an ArcGIS data store. All of these aspects work together to create effective software.


Chapter 6 is all about spatiotemporal data and real time GIS. Spatiotemporal data is categorized as moving, discrete, stationary, or change. This is important to real time GIS because it is a way to provide better situational awareness, enhance emergency response, and support better decision making. This chapter also talks about the Internet of Things (IoT) which is the network of physical objects embedded with sensors and network connectivity that allow the physical objects to collect and exchange data. This data can be understood as intelligence which, with geolocation context, can be acted on. The IoT can be applied as a smart city or a smart home. Chapter 6 also discusses ArcGIS Velocity and ArcGIS GeoEvent Server. Both softwares interact with various data sources and translate different data formats, filters and analyzes data in real time, and sends processed data to external sources.