Chapter 5:
On a practical note this chapter might be difficult with my commuting status… do we have to do this on the GIS lab computers or is there a cloud we can access? Addendum: No haha
The data analysis and deep learning mention makes me wonder if I could apply that to my project, making identifying invasive plants easier? I want to do something with that in this tutorial and I feel a little let down now.
Most of the pre-tutorial seems more important to OWU than us. Unless my practical concern is a concern. Also it’s all so much technical jargon that it’s hard to keep up.
I remember sharing maps from ArcGISPro in 291 so I understood the first parts of the tutorial pretty well. One thing I noticed was that the file sizes for the cached layers were a lot lower than the tutorial said, maybe it was another update or I skipped something, but I tried to go back and there weren’t any errors. It will be interesting to see how the same layers compare as different types. I guess using the web maps provided means I won’t find out if I made a mistake with the detail level sliders provided.
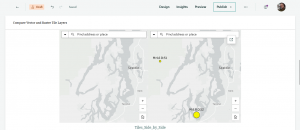
Making the story with the provided web maps and app was pretty easy. I struggle a little to format the stories and make them look nice still though. I’m pretty sure the map on the left in the app is the raster tile layer, because I don’t have to zoom as far in for the features to disappear. I can definitely see how vector layers are more useful for general cartography, while raster tile layers would be more for specific requests.
Chapter 6
The concept of smart cities and smart homes is a little frightening to me… but I see how important GIS is to those things and the IoT. Without those connections between everything GIS could not exist, and the connections themselves rely on GIS.
Geofences seem like the real time version of the buffers we did in ArcGISPro.
Is there a dashboard for making one mega franken-app
Some dating apps also use missions I think?
The tutorial starts by having us look at emergency dispatch maps that constantly refresh, then add live highway views. I think I see stuff like these for trail cams sometimes.
To put the map, gauge and list together I just kind of dragged them and didn’t need to resize the map. There is an extra list in my dashboard because I didn’t do all the steps on the first one and then couldn’t figure out how to delete it!
As I added more elements, things got kind of squished and the pie chart became tiny. Can a dashboard have multiple pages? Adjusting the map helped slightly to make things more proportional, though.
I couldn’t see the text color change but maybe none of the presumably fake people were having a heart attack? I tried messing with other colors in other parts of the code and making sure both highlighted parts were in there but to no avail. There were 3’s on the list so I did do something wrong -_- I couldn’t get any of the arcade parts to work so I’m skipping that because honestly!!! I’m doing this late and going kind of insane.
Here is my dash board, good luck knowing if someone’s having a heart attack.
I noticed the option to set the time zone was in map viewer, not when I uploaded the layer.
The time slider settings option was nonexistent ok.
Here is the app!
https://arcg.is/0u809H1