Chapter 3 explores the use of ArcGIS Experience Builder as an interface and tool to build more functional web apps with minimal programming and minimal code involved. There are integrated premade widgets with this that provide functions like mapping, table view, querying, charting, and reporting. Essentially these things interact with the 2D or 3D data we are working with. The primary elements of experience builder are templates, themes, widgets, pages, windows, layouts, data sources, and actions. These are all discussed and the table, filter, chart widgets, dynamic content, and actions components are put into action in the tutorial. There are three options for how to use experience builder. You can start with a template for apps for mobile devices, you can modify and customize templates for whatever medium or screen size of your choice, or finally you can build a web app from the very beginning allowing for the creation of a precise and personalized web experience. A web experience is essentially a web app created through experience builder. From my understanding, experience builder prioritizes a mobile device design and layout. Widgets seem to be super effective and useful. You can formulate a custom widget or theme as well as make widgets react to various actions. Basically these widgets are tools that can be added to the map/app and how they show up and perform can be configured by us whether it be to analyze data or to work with feature layers by adding or editing them. In terms of the work flow for configuring a web experience we start with starting from scratch or selecting an existing template to use. Something important I took away from this from the book is that the categorization website is a template that exists across multiple pages. Then you pick the theme which is just for looks not impacting the layout and its content. At this point, we can bring in feature layers that we assembled or that we downloaded, etc. We can also bring in web maps or web scenes. The fourth step in this workflow is to work with basic/ functional widgets or layout widgets. A basic widget has functional capacity acting as a tool for the app including map, legend, layers, query, filter, edit, chart, elevation profile, survey, and more. Layout widgets are organizational widgets that help for organizational purposes including section, column, row, fixed panel, sidebar, and more. These are the two types of widgets. Once we implement widgets into the web experience, then we can configure associated data sources, styles, and actions. Next, different layouts can be made of the page(s) of the web experience. The options include layout for small, medium, and large screens. The layouts are kind of refined and adapted to the web experience. This reminded me of a bit of smart mapping in the previous chapters and geog 291. The final step is the finalization process including saving, publishing, and sharing the web experience. The previous process is versatile and is nice allowing us to visualize how our creations apply to say a mobile device versus a desktop. We have options of mode inducing a draft, published version, or published with unpublished changes where the draft mode is the best case scenario for edits to be made without impacting the published version. This is the general workflow. The book moves on to discuss the basic components of web experiences which can have one page or be multiple pages or windows as I have indicated previously. The web experience overall as one consistent theme yet each page can have individualized template layouts. A page as the foundation of these web experience apps contain a header, a footer, and a body, by default. A menu widget can be added to apps with more than one page to show those pages in a menu selection type of thing. Windows are different from pages in that windows only have body content but can appear in a certain position or appear next to a relative widget tool. The fundamental uses of windows include splash, alert, confirm, and ToolTips. Each page or window has an outline view which actually displays all the widgets involved. This makes widget functioning and management more efficient as if you want to copy a widget it can be copied and the settings will be carried over without having to recreate the widget essentially. Widget settings for configuration include content, style, and action. Content has to do with the data sources, the associated links, the behavior, and so forth. Style has to do with things like size and color. Actions are performed by widgets and allow widgets to work together and work off one another. Widget actions include message actions and data actions. Message actions act on their own based on triggers, requiring you to define a trigger, a target, and an action. Data actions occur manually and these must be selected from a pre-configured list. The three components of message action configuration are triggers, targets, and actions. Basically a trigger is the event that starts an interaction like a map extent change whereas a target is the widget or the framework that responds to a trigger. An action is the actual function or operation that the target performs like zooming out and panning to a new location. Dynamic content uses different widgets to show information that changes based on user interaction, things like data updates, or other connections. Basically various widgets like text, list, or image are connected to a data source in which attributes or statistics for instance, populate them. The final part of the chapter talks about the three editions of experience builder. One point highlighted is that the ArcGIS Online edition doesn’t allow for custom widgets. Developer edition is the most advanced and enhanced edition but has to be set up.
In this tutorial for chapter 3 I created a single page and ultimately a multipage 2D and 3D web experience using the ArcGIS Experience Builder. I added widgets, including section, map, image, text, table, tilter, chart, and menu. In addition, I configured widget content, styles, actions, and animation. I did this all without programming which is part of why this is so efficient and useful wide-scale. I like how experience builders can integrate 2D web maps and 3D web scenes, that is that these 2D and 3D views can be in one app whereas before I remember these kind of being separated. The tutorial went smoothly for the most part. It took me a while and there were inconsistencies in the process and the actual actions I was performing in experience builder. You kind of have to just work through these things, use your intuition, make the best decision based on your experience, push through. The main problem I had was adding the URL (bit.ly/3pGylar) to the alerts page. I kept getting a warning saying that only HTTPS is supported. I made sure I typed the URL probably considering it is case sensitive but I could not get the sample from the ArcGIS API for JavaScript document site. What I did instead was go to the site and copy the full URL from my browser and put that in. It worked out. Here are some screenshots from my work, one from the design window and one from the preview window:
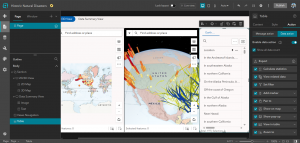
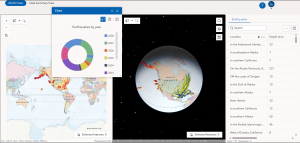
One idea for an app using material from chapter three is to create an experience involving a corporate map and facility finder. I thought about this in the context of my family business. We have a new headquarters and new office buildings. This could help employees, visitors, or applicants. navigate a large facility area. Widgets could be used to locate a certain building and pop-up windows could show things like office hours of operation, reference images, and maybe even directions can be integrated in some way. I would use the filter widget to allow the user to filter for a department or something. I could even go all the way and add an embed widget for which I could include a live Survey 123 form for facility feedback of the new corporate headquarters.
Another idea would be to use the web experience setup to formulate a 2D as well as a 3D mapping of urbanization and development generally here in Ohio or elsewhere. The intention would be to display the impact of urbanization on agricultural endeavors.
Chapter 4 discusses the connection between Web GIS and the proliferating use of mobile technology in the modern era. The chapter explains how Web GIS has adapted to that trend, the need of many populations all over the world through which feature layers can be edited and the implementation of three options of app building. ESRI mobile apps are introduced like ArcGIS Field Maps. I remember a bit about the popular types of apps and frontiers from chapter one. Chapter one touched on this idea of mobile pervasiveness and Web GIS and how to best utilize Web GIS in this modern context. I like the idea of mobile GIS and I like how the book compares this to desktop GIS. This got me thinking about how with geog 291 we needed a desktop, or a strong windows computer but with mobile GIS you just need your phone for instance. Before I get into what the book says I think something super valuable about mobile GIS is its facilitation of field work. Whether it be in data collection or real time information collection, I think mobile GIS has particular prominence and advantageous capacity out in the field. The book also mentions the facilitation of communication through which professionals in the field and consumers can both simply interact or collaborate on a deeper level. Location awareness and mobility are some other benefits of mobile GIS. I think Mobile GIS’s application to a range of wireless communication technologies like Wi-Fi, cellular, or even Bluetooth is super cool. As with everything, there are limitations and so technology has become so advanced that these limitations are minimal I would say but also are continuing to be minimized. With that, limitations must be considered in that the screen size of a phone is much smaller than that of a computer, along with other functioning capacity like battery size and CPU speed. Ultimately, mobile GIS can be used by anyone whether it be an individual for personal use, to learn what are the best places to visit in a city, or more formal use for an organization to explore data or conduct field surveys. The next part of the chapter talks about editing feature layers, views, and working with feature templates. Although you can edit features with ArcGIS Online, the book points to the fact that ArcGIS Pro is the best option for editing capabilities. We can allow users to add photos or other files to feature layers if we enable attachments and we must be the wonder of hosted feature lay or the admin of an organization to make such edits. Edit tracing is also a capability through which changes in the data of a feature can be monitored and analyzed. One way to make it so different groups can see different sets of info in our hosted feature layers is to create a view layer from the hosted feature layer. This is super useful for allowing organization members to maintain the authenticity and up to date status of data while also sharing the data with other groups and the public. This view would have editing capabilities turned off but the good thing is the public sees any updates or changes to the other layer that is manipulated by the organization as both layers reflect the same data. A cool side note is that Survey 123 is used to create smart surveys, Arc GIS creates a feature layer and the associated view(s) for us. Moreover, a feature layer can have a feature template which defines the type of data items that users can add to a layer. A benefit of this is that it ensures the accuracy, reliability, and consistency of the data while making things in terms of editing efficient for the user. This feature templates are used a lot with mobile data collection. Next, there are three mobile app development strategies including the browser-based approach, the native-based approach, and the hybrid-based approach. Native apps are the apps that we install and download on mobile devices. These are good but have a high cost limitation. ArcGIS native apps for field operations include ArcGIS Field Maps, ArcGIS Survey123, ArcGIS QuickCapture, ArcGIS Navigator, ArcGIS Companion℠, ArcGIS Earth, ArcGIS Mission Responder, and ArcGIS Indoors™ mobile viewer. These apps intentionally apply to all areas of field work like planning, navigation, coordination, and more. ArcGIS Field Maps is very versatile and supports the planning, tracking, understanding, and data capture phases of field workflow. ArcGIS Field Maps allows users to show web maps, seek out places and features, and be directed to those places. There is a web app and a mobile app. The mobile app has an offline mode through which you can manage work while in remote areas or areas in the field out of the office basically. The mapcentric data capture component is cool as it allows users to collect and organize geographic info with an interactive map. ArcGIS Field Maps knows what is happening in the field and feeds tracking data into a location-tracking feature service which stores tracked locations as features. ArcGIS Field Maps is integrating ArcGIS Navigator and two interesting things with this is that an organization’s own data and unique or specialized navigation rules can be used along with the option for downloading maps for offline mode navigation use. ArcGIS Survey123 allows us to collect field data in a structured way and create surveys with pre-defined questions that connect to feature templates, domains, default values, and so forth. Offline and online data collection is possible with this as well and survey results can be stored in hosted feature layers and can be shared. The two ways to design smart forms with Survey123 are Web Designer and ArcGIS Survey123 Connect. The first option is easier while the second option is a desktop app that applies to more complex rules and advanced questions. ArcGIS Survey123 Connect has the ability to pull data from CSV files and use JavaScript for more advanced capabilities. ArcGIS QuickCapture involves rapid data collection. Essentially this is used to collect data up in the air from a plan or helicopter, from a moving vehicle on land, etc. It organizes the data to be collected and users can do inspections by collecting locations or even photos rapidly. ArcGIS QuickCapture allows whatever data is captured to be sent back to the office or headquarters and whether it is additional data or new data this data can be transported and used in real time. ArcGIS Indoors mobile app pertains to happenings within an organizational internal environment. The relative indoor mapping, routing, and collaboration create a scenario in which you can feel more comfortable and connected with your workplace or campus or business. Wayfinings navigation helps you find your way around for instance your campus through using Wi-Fi and Bluetooth IPS. There is also a calendar integration which considers calendar events and connects them to navigational needs and how to navigate timed obligations and how to get to those things. Explore and research allows for searching for people, or a certain building, or a certain event like if you want to know where the convention is being held for example. You can report incidents or or problems to your organization of a facilities team via launch actions. Lastly, users can share their locations in order for the organization to support activities or support research direction and so on. ArcGIS Companion is a native mobile app. Thai app gives access to your ArcGIS organization, content, and profile and allows you to see alerts and news or updates from your organization. ArcGIS AppStudio allows you to form custom mobile apps across platforms, for instance using ios and windows. The book moves on to explore VR, AR and LBS’s. An LBS or a location-based service, uses a device’s geographic location to provide specific information or features. Points of interest (POI’s) are considered and used. Volunteered Geographic Information or VGI is essentially geographic data contributed by the public not a formal organization and this is often employed on mobile devices. Through crowdsourcing, VGI can add value to warning systems for natural disasters, epidemics, or other real time societal occurrences. VGI is a source of big data and Survey123 is best for VGI collection as when a survey form is shared with the public, anyone can partake in it. VR is a simulation of a 3D map or environment that is generated by a computer and can be interacted with in what seems like a reality using special electronic equipment. VR is becoming more immersive and accessible with the advancement of tech in coherence with mobile proliferation. AR is similar but different in that it overlays information that is computer-generated on the live view through a device like an iPhone or a camera device. ARworks well with Mobile GIS because a mobile device gets information based on where you are, where you are facing, and so forth. It can overlap this info in the camera view. The fundamental distinction between VR and AR is that AR enhances the perception of reality whereas creates a simulated view of reality by replacing the real world with the simulation. ESRI has AuGeo which is a mobile app that augments reality. You can do things like overlay symbolized point features from hosted point feature layers in ArcGIS Online, over a view captured by the camera on their device. ArcGIS runtime toolkits have an AR view element that developers for instance can use to construct specialized AR experiences like table tip and world-scale experiences. For tabletop 3D content is placed on top of a real world physical surface or scene through a simulation. With the world-scale experience GIS data is retrieved and shown on top of the camera view appearing like it is actually visible in real life. Mobile GIS can not only retrieve GIS continent but also use things like edge computing and computer vision technologies to detect objects in the camera views. For instance Survey123 can recognize plant or animal types for leaf images or fur images.
For the tutorial there were four total exercises I did and I downloaded and used the Survey123, Field Maps, QuickCapture, and AuGeo mobile apps when needed.
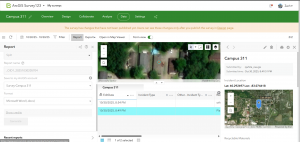
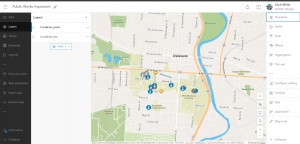
I had an issue with tutorial 4-1 Question 13 and 14 with setting a rule for the incident type question. I wasn’t able to make the visibility of the recyclable materials question conditional on whether the incident involves recyclables. This was annoying and took me time working at it, but I was able to continue and it didn’t cause that much of a problem down the road with things.
For tutorial 4.6, questions 18-20, I ran into another issue. Basically I was trying to configure the pothole incident type to require users to specify the details when reporting a pothole. When I attempted to create a new user import, I was able to do everything except actually create it. There was NO create button. Here is a screenshot of what I mean. This was the very last part in tutorial 4.6 and so I moved because it became super frustrating. I also got three warnings when I tried to save it.
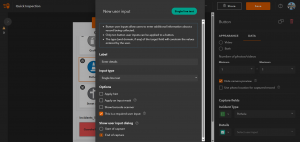
For tutorial 4.7, question 5, I was unable to add details about the pothole incident. This was because of an issue earlier in 4.6. Only a photo was taken and sent through. I get the gist of it though.
An idea I have for chapter 4 is to create an app that can report roadside hazards. I thought about this given the big hurricane that recently swept through Jamaica and the Caribbean. Things like fallen trees, street damage and potholes, debris, or non functioning lights are examples of potential reportings. ArcGIS QuickCapture would be great here as these hazards can be reported while driving along, pictures can be taken of the hazard, and so forth. This can assist emergency response teams as well as other essential entities. I can envision this data collection syncing in real time to a live dashboard or map. Another similar idea is flood damage assessment and management. An example of how ideas from chapter 4 could be used here is that first responders could use ArcGIS QuickCapture for a general evaluation of the extent of damage done by the flood/storm. Then I could have a survey123 form for more specified teams to come in and assess in depth, attaching photos, requesting resources, collaborating with agencies and so on. Furthermore, a super cool application for ArcGIS Field Maps that I found researching is hydrography used by ships, coast guard, and other law enforcement. Field maps include the navigation component and goes beyond just producing charts and so this has become a big use for ports all over. Crews can also partake in viewing or collecting data out at sea with offline mode if needed.
I think the app I will make from chapter 1-4 will be an ArcGIS story map that shows the circumstances of species like the sand tiger shark in the face of ocean warming. I’ve explored sea surface temperature and other relative layers from ArcGIS Living Atlas of the World. I am passionate about the oceans and I think it would be cool to show temperature trends over time, integrating sharks in some way. I wanted to do this idea even more considering the recent category five hurricane that developed to that level of intensity literally as a result of warm and warming waters.