Chapter 3 –
In chapter 3, I learned how to create a public web experience to display data, specifically earthquakes and hurricanes. I listed data in tables that allows users to select records and filter maps. Using this data, I was able to display earthquake summaries in a chart and popups, which I then organized to allow users to filter features based on attribute fields. I also learned how to customize widgets.
- First, I created a new experience builder with a blank canvas.
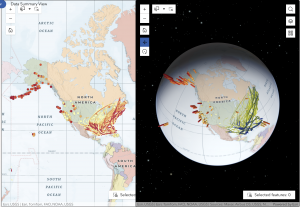
- I entered the sample chapter 3 disaster data onto the blank canvas. This data created a 2-D map.
- On the experience builder, I created widgets by dragging them from the panel of widgets. Then, I customized the size of the widgets to better fit the screen and incorporate other widgets.
- Along with the 2-D data, I also added 3-D data following the same steps and adding widgets. With one of the widgets on this layer, I added an image widget that I uploaded from my computer.
- I learned how to make animations so that switching slides in the presentation is more fun!
- I learned how to configure map message actions, which allowed me to automate responses to specific events within the application.
- With text widgets, I was able to add lots of different content and information about the earthquakes and hurricanes that happened in the different locations included with the data set.
- I added chart and table widgets to display information on the web experience.
- I was able to add multiple pages to the web experience I created, allowing me to have a home page and different content pages.
- Last, I shared my web experience with the public after previewing it.
- I think that most of the instructions for this tutorial worked or at least were easy to figure out if they weren’t correct.
Chapter 4-
In chapter 4, I learned about 4 different applications. I learned how to make surveys, use field maps, Quick Capture, and AuGeo. I really liked learning how to use Survey123. However, I was having a hard time with this chapter tutorial because a good portion of the tutorial was inaccurate and I could not get things to work. It was only a couple of steps, but it created a cascade that made it impossible to do following instructions because a previous step did not work. I was not a huge fan of having to download a couple of extra apps onto my phone just to use it for a few steps of the tutorial, especially when some of the instructions were inaccurate.
- This chapter started off with logging into Survey123 associated with ArcGIS Online.
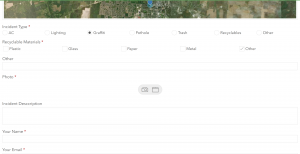
- I created a new survey using the prompt from the book: A university wants its students, staff, and the public to report nonemergency incidents on campus. With this prompt, I was able to create questions that coincide with different incidents that may occur on campus, including AC, lighting, graffiti, etc.
- On this application, I was able to add questions pertaining to description of the incident, as well as contact information.
- Learning about Field Maps is helpful, but I wish that the steps on the tutorial would have been up to date with the program because I got stuck and couldn’t do much with it. I got stuck at street cracks and guardrail issues, which inhibited me from being able to do things with that layer later on.
- An application that could be created using the information I just learned about Survey123, Field Maps, Quick Capture, and AuGeo could be one that collects data on the best places on and off campus to study or on different species of plants found along hiking trails.