Chapter 1:
Much of the information covered in this chapter was covered in the readings and activities in the previous week, though much more in-depth. It focuses much more on the computer science of WebGIS, including listing the technologies and coding languages used to make everything possible, the different file types, etc. I had no idea that the biggest corona virus tracker was made in WebGIS, though it makes perfect sense that it would be the case. This book certainly explores the range of WebGIS applications, especially through it’s activities.
This chapter also covers the history of Web GIS, and vaguely how it reflects the history of the web and information sharing. It is very interesting to see how the growth of the internet has caused information to become so easily accessible and sharable. There are groups dedicated to collecting and processing information, but individuals can just as easily contribute to the massive catalogue of knowledge stored digitally, simply from their personal devices.
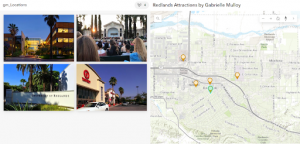
I completed the chapter 1 activity, creating and publishing a web application that displays attraction locations in Redlands, California, fit with popups with image attachments.
Chapter 2:
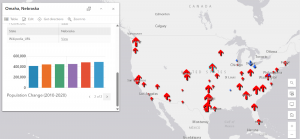
This chapter covers web stories and their importance, which is a type of web application like the one in the previous chapter’s exercise. There’s a chart in this chapter with a list of all the different ways to style a map for different purposes. This is important to do in ArcGIS pro, mostly for the user to be able to understand the data they’re working with, but I imagine that it’s significantly more important to do in WebGIS given that it’s likely non-geographers will be viewing the data. It needs to be formatted in a way that is easy and intuitive for people lacking a geographical background to understand. I believe this is also the purpose of their coding language Arcade, which is specially designed for visualization.
I completed the activity, which taught me how to customize pop ups, symbology, charts, and web stories.