Hey, I’m Haruno Tadokoro and I’m a junior majoring in Environmental Science and minoring in Politics & Governance. I took GEOG 291 in the first module.
This week, I reviewed the course blog, syllabus, and schedule, completed the required readings and training, and took the quiz.
Since I already completed the ArcGIS Online account setup and the “ArcGIS Online Basics” training in GEOG 291, I reviewed my account briefly this week and made sure everything still works.
After reading ESRI’s “Get Started: What Is ArcGIS Online” page, I learned that ArcGIS Online is very convenient because I can access it from my own computer and work anywhere. I also like that publishing and sharing data online reduces the burden on internal systems and makes data management more efficient.
While taking the ESRI Training Course “ArcGIS Online Basics,” I found information about basemap layers, operational layers, and 3D scenes.
Basemap layers provide geographic context, like imagery, boundaries, or roads, while operational layers are placed on top and contain the data you can interact with—such as viewing information, editing features, or running analyses.
I also learned that besides creating 2D web maps, ArcGIS Online allows users to build 3D web scenes to better visualize and analyze geographic information in a three-dimensional environment. Both the Map Viewer and Scene Viewer can access a default collection of Esri basemaps.
I’m interested in two other ESRI courses: ArcGIS Pro Fundamentals and ArcGIS Pro: Essential Workflows. They both seem helpful for improving my GIS skills and learning how to use ArcGIS Pro effectively.
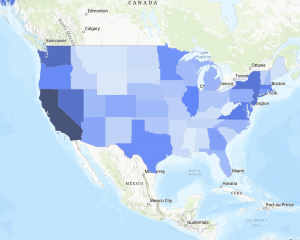
I found an interesting layer in the ArcGIS Living Atlas called “Asian Alone or in Any Combination by Selected Groups.” It shows recent ACS 5-year data about Asian populations by tract, county, and state. I thought it was cool that the layer updates automatically every year and can be used in different ESRI apps like ArcGIS Pro and Story Maps.
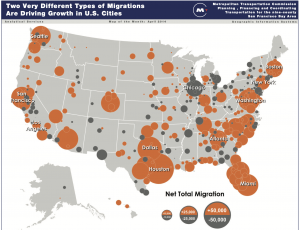
Also, I found a map called “Metro Population Growth and Decline in the United States.” It shows how metro populations across the U.S. are growing or shrinking based on both domestic and international migration.
According to the data from the U.S. Census, large metro areas like Houston, Dallas, and Phoenix are growing fast, while some big cities like New York, Los Angeles, and Miami are losing domestic residents but gaining immigrants. I thought this was a great example of how GIS helps visualize complex population trends.


