Hey guys, I’m Alex Bzdafka, a biology and environmental science double major. I’m a junior, I’m on the track team as well as a member of the student board and a department manager.
I started out the week by reading the syllabus and taking the quiz. I already have an Arc account from 291, so I did not need to do any poking around.
Introduction to ArcGIS online: Overall Arc online is a web based version of Arc that uses cloud access to store information, this is great because it means you can work on a map from anywhere that has internet. It also makes it easy to get data from others. Arc online is also useful because it is possible to work collaboratively on the same map with a team. Because Arc online is cloud based it saves internal storage on whatever device it is that you are using. Arc online is also a useful field tool as it can be accessed via a phone, allowing you to use the tools in a remote location. It is also helpful because you can add a point where you are (corresponding with your point in the field).
- Scene viewer: a more intuitive way to visualize spatial data, both 2-D and 3-D, and is exclusive to online.
- Notebook: Another feature unique to the online version of Arc. It allows you to work with data, and it helps with workflow. It combines coding, maps, and data tools.
- Apps: A way to control how users can interact with maps
After skimming through the website I moved on to the ArcGIS online basics.
- Arc has 3 account types which induce: Organization, personal, and social. Organizations allow for data to be shared easily within the organization. This makes it easy for collaboration to occur. Individual accounts are free, but have limited usage. Social accounts can access maps, but cannot do much else.
- Web GIS has similar functions like layers and 2D maps like desktop, however it also has scenes which are 3D maps. It also includes apps which can help control how users interact with maps.
- The layers on top of the base map are known as operational layers.
The tutorial had me do an exercise with data about the Sierra Nevada mountains.
- To add data from the web click add layers, then select GIS online or wherever you want the data to come from, and then you can search for and add layers.
- You can search for bookmarks or for data points by using the search tool (magnifying glass) on the right side of the screen.
To create a quick and easy web app
- Expand the right portion of the screen and click create app then instant app. You can preview what the app will look like by selecting preview.
For a paper using WebGIS, I found one that tracked production of CO2 during 2019 vs. 2020.
I found another tutorial that looked interested in is titled: Reveal lake shrinkage due to severe drought.
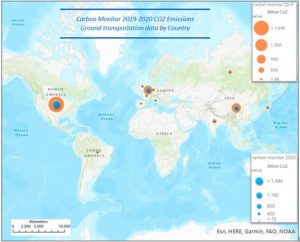
Web map showing amount of CO2 produced in 2019 compared to 2020