Chapter 3 dives into ArcGIS Experience Builder, and I found it to be a really flexible and user friendly tool. It stood out because it supports both 2D and 3D maps and gives you the freedom to organize and design how you want your content to appear. Pages act as the main structure, and widgets tools you can place on the page let you customize interactions. There are different types of widgets, and each one can perform specific actions, including message based interactions that connect with other parts of the app. What made it all easier to understand were the tutorials. They walked me through the steps in a way that made everything feel approachable, even without a strong GIS background. It’s a great example of how the platform isn’t just for professionals it’s accessible to anyone who’s interested.
Chapter 4 shifts the focus to Mobile GIS, which is becoming increasingly important as more people use smartphones rather than computers or tablets. Mobile GIS makes it possible to access, collect, and work with spatial data from anywhere, thanks to wireless internet and the speed of mobile devices. While it’s not always easy to work on a smaller screen, especially with large datasets or complex features, mobile apps like QuickCapture and ArcGIS Indoors really open up new ways to engage with GIS in real time. I liked how the chapter made clear when it makes more sense to use mobile GIS versus WebGIS. It helped me understand that while mobile is great for on the go work, certain tasks still benefit from the broader screen and functionality of a web-based setup.
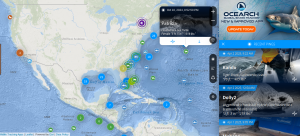
After working through the “Explore your surroundings in AR” tutorial, I started thinking about how cool it would be to create something similar for downtown Delaware. I’d love to develop an app that lets people learn about historical landmarks and local attractions just by pointing their phone camera at them. It would be a fun and educational way to explore the city, using augmented reality to make the experience interactive and engaging.
Since I took GEOG 291, I’ve already completed the Delaware Data Inventory. It was interesting to revisit some of those layers now that I have a better understanding of how they can be used in different GIS applications. Layers like Zip Code, School District, Parcel, and Building Outlines offered a strong foundation, while more specialized layers like E911 Data, PLSS, and Annexation added deeper historical and emergency context. The Recorded Document layer was one I found especially interesting it was cool to zoom in on OWU and see university housing data pop up. Another standout was the Dedicated ROW layer, which shows which roads are designated for public access. Even the more complex or less familiar layers, like Subdivision or Farm Lot, offered a glimpse into how much information is available to work with if you take the time to explore and interpret it.
When comparing Experience Builder with Web AppBuilder, both tools are solid for creating web apps, but they differ in style and flexibility. Experience Builder feels more modern and creative, with its drag and drop interface and mobile friendly design. It’s perfect for mixing maps, dashboards, and charts all in one place. Web AppBuilder is a little more straightforward, using pre made templates and a library of widgets to help get basic apps up and running quickly ideal for quick projects or for folks who are just starting out.
For my own application idea, I want to use the Delaware data from GEOG 291 to build a web app in Experience Builder that highlights flood risk zones across the county. The goal is to let users explore which areas are most vulnerable, compare that with demographic data, and link to local emergency planning resources. With customizable widgets, I can make it easy for users to filter by flood zone severity or population characteristics. I think this kind of tool would be valuable for both public awareness and local planning. I’m also interested in using Survey123 and Field Maps for future applications tied to public health or environmental data, since mobile GIS makes real time data collection and access in the field so much easier.