Hi everyone! My name is Will White, and I am a Business Management major at Ohio Wesleyan University. I am also a member of the OWU men’s lacrosse team. I am excited to start this course and explore how Web GIS can be applied in different industries, including business and sports analytics.
I accessed my OWU ArcGIS Online account and explored its features, including My Profile, My Settings, My ESRI, Training, Community and Forums, ArcGIS Blog, and Help. I updated my profile information and found that the Training section offers a wide range of courses, many of which are free for OWU students. The ArcGIS Blog provides industry updates and case studies, which I found useful for learning about real-world applications of GIS technology.
I read through “Get Started: What Is ArcGIS Online” and learned that ArcGIS Online is a powerful platform for creating interactive maps and analyzing geographic data. One of the most valuable features is the Living Atlas, which provides access to a vast collection of datasets that can be integrated into projects. Another key takeaway is that ArcGIS Online enables collaboration by allowing users to share maps and data with others, which is beneficial for businesses, researchers, and community organizations.
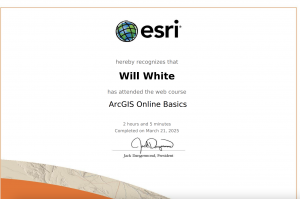
I completed the ArcGIS Online Basics course, which introduced me to core GIS concepts. The course emphasized how feature layers allow for detailed data visualization, making it easier to analyze trends across different locations. I also learned about the Web AppBuilder, which enables users to create interactive applications without needing to code. This makes GIS tools accessible to people who may not have a technical background but still need to leverage geographic data in their work. I have attached screenshots of my course completion for reference.
While exploring additional ESRI training opportunities, I found two courses that seem particularly interesting. The first is “Spatial Analysis with ArcGIS Online,” which covers in-depth mapping and analysis techniques that could be useful for data-driven decision-making. The second is “Cartography with ArcGIS,” which focuses on effective map design and data representation. These courses could help me improve my GIS skills beyond the basics and apply them to business-related projects.
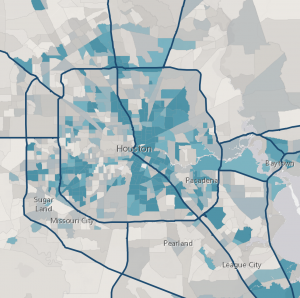
For my GIS applications research, I looked into two real-world uses of ArcGIS Online. The first is a map created to visualize evacuation routes and impacted areas during Hurricane Harvey in Houston, Texas. GIS was used to track flooded zones, population density, and shelter locations in real time, helping emergency responders and city officials make faster, more informed decisions. This application of GIS showed how spatial data can play a critical role in disaster response and urban planning. The map displayed not only road closures and water levels but also helped optimize the movement of people to safety.
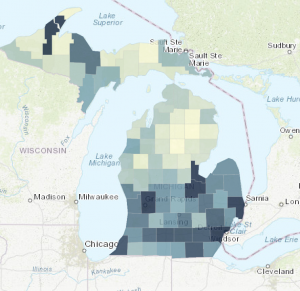
The second project I explored is a historical population map of the state of Michigan from 1900 to 2020. This interactive GIS map visualizes demographic changes over more than a century, showing growth patterns, urbanization, and population shifts between rural and urban counties. It helps users understand how migration, industrial changes, and economic development have affected the state’s population distribution. Tools like these are particularly useful for researchers, city planners, and policy makers who want to visualize long-term trends in a clear and accessible format.


