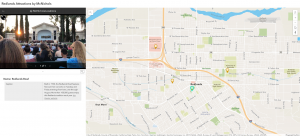
WebGIS has global reach, a large community of active users. Its often cheaper to build a program with WebGIS than to build and install a standalone program, it has better cross-platform capabilities, and it is easier to use and maintain. Being stored on the cloud offers ArcGIS online a lot more scalability, agility, and cost efficiency compared to on-premises data storage. Variable web GIS sites all being stored within ArcGIS instead of independently hosted allows for easier communication between them, and the platform has also allowed for a two-way flow of information allowing users to volunteer geographic information. It also prioritizes function for mobile devices as those are the primary way the majority of people are accessing online information. The platform also allows the conversion of 2D maps into 3D web scenes that can also be interacted with through virtual reality. Web GIS content is broken down primarily into data, layers, tools, web maps, scenes, and apps. An app is comprised of a basemap that provides geographical context, the operational layers that you interact with, and the tools that perform tasks beyond mapping like analysis. There is not a community map option on the main page Basemap button of 1.3, I did find one though by using living atlas. Working from the assignment ideas from chapter 1 I could create a map of the different locations I’ve traveled to as a part of cross country and track, we’ve gone pretty far.

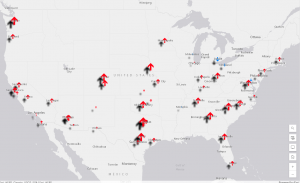
Feature layers are the most common operational layers, they’re basically web services that can be reused across many different programs. Hosted layers are stored in the Esri geospatial cloud while unhosted layers are stored independently. Hosted layers are granted a lot more features and flexibility through Esri. One feature available through Esri is Smart Mapping, which allows you to change the style of a feature layer into a heat map, a comparison map, density maps, and much much more. Pop-ups allow you to provide additional information and insight. The Arcade feature is similar to Microsoft Excel’s formulas which allows you to add values to pop-ups for information that’s not in the attribute field of the layer. The living atlas is an incredibly large database of layers, maps, tools, and apps produced both by Esri themselves and by contributors, a wealth of resources available for use. WebGIS wants you to prioritize an app being fast, easy, and fun. Through a use of maps, narrative, and multimedia you can create a story that engages your users. The most populated cities in the chapter 2 tutorial are New York City and Los Angeles. The drop shadow settings seem pretty extreme and are very unaligned with a lot of the smaller arrows.
