Tutorial 6
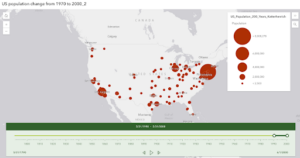
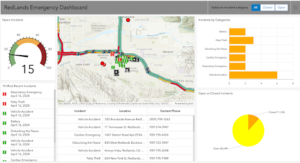
In this tutorial, I created another web map using real-time layers and made a dashboard based on this web map, I thought was cool because it displayed continuous data and even photos in real-time. In another section of this tutorial, I added a selector that allowed users to filter the dashboard so that it shows specific types of incidents based on any filters that were selected. I also was able to animate the time-series data in web maps and web apps. I found this part to be interesting because it displays the information and data in a way that is easily understood by users. I think I would like to utilize the real-time features from this tutorial in my final project, because of the engagement aspect of it.