Chapter 1:
I think it is very cool and important that a part of data analysis can be so visual. I know for me that this makes data more digestible and understandable. I liked the figure describing the multiple pathways and “generic workflow” for creating web apps. One thing that I think will take some getting used to is figuring out and deciding what map style will be the best to display certain information. I assume this will come with trial and error and testing out what works best with what kinds of data.
A question that came up is how do I access “Arcade?”
Tutorial 1:
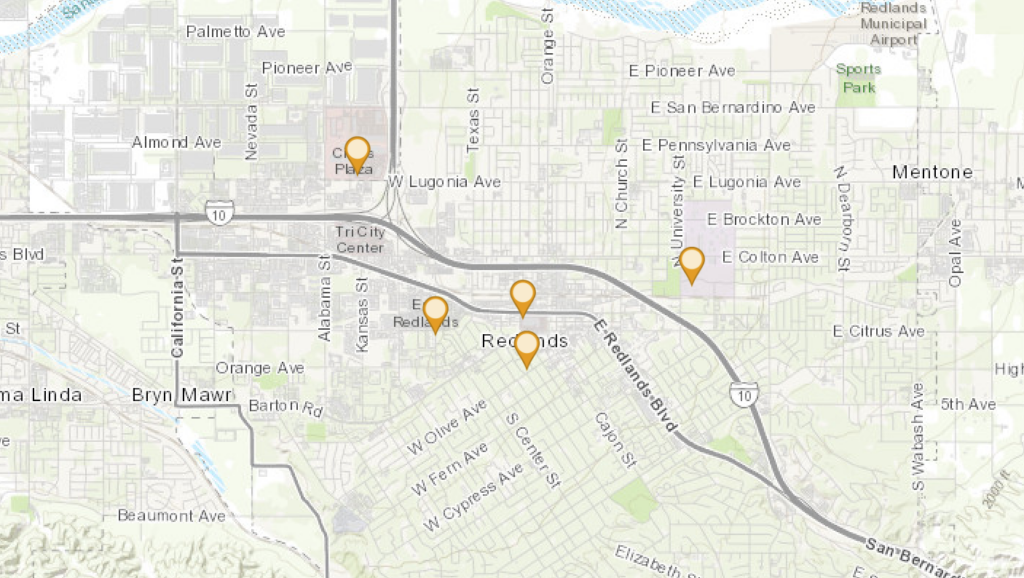
This tutorial was very helpful in terms of learning how to get a map/app to look the way you want it to. This eased some of my worries about picking and choosing what style goes with what. I believe now it is really whatever looks right in the moment and it can always be changed to represent something different.
Chapter 2:
I think the ArcGIS Living Atlas is such a cool resource that really has a lot of information present in one place. It is also cool that it can be updated in a matter of minutes. The idea of storytelling through these maps and apps is such an engaging way to think about gaining information. I like the visual of Maps+Narrative+Multimedia=Story.
Tutorial 2:
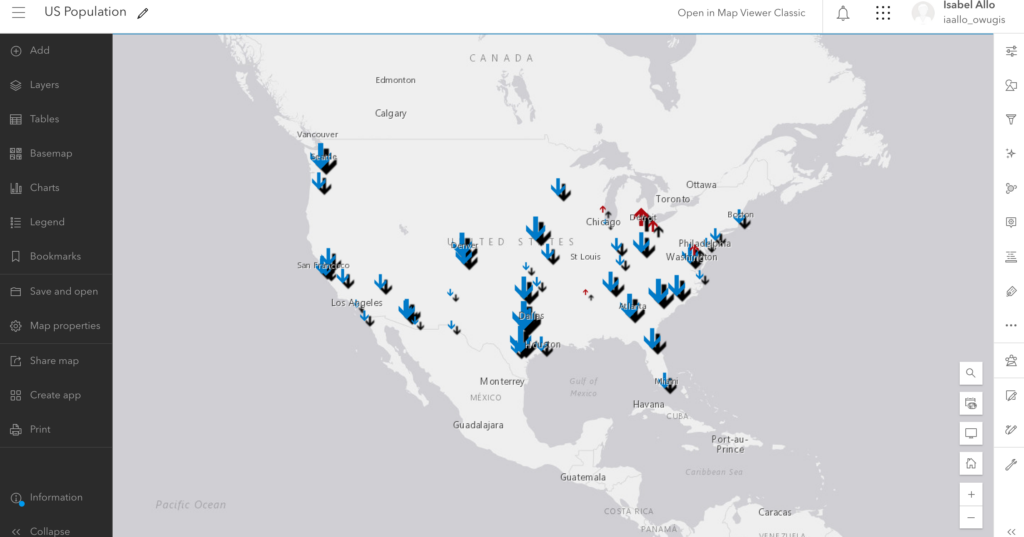
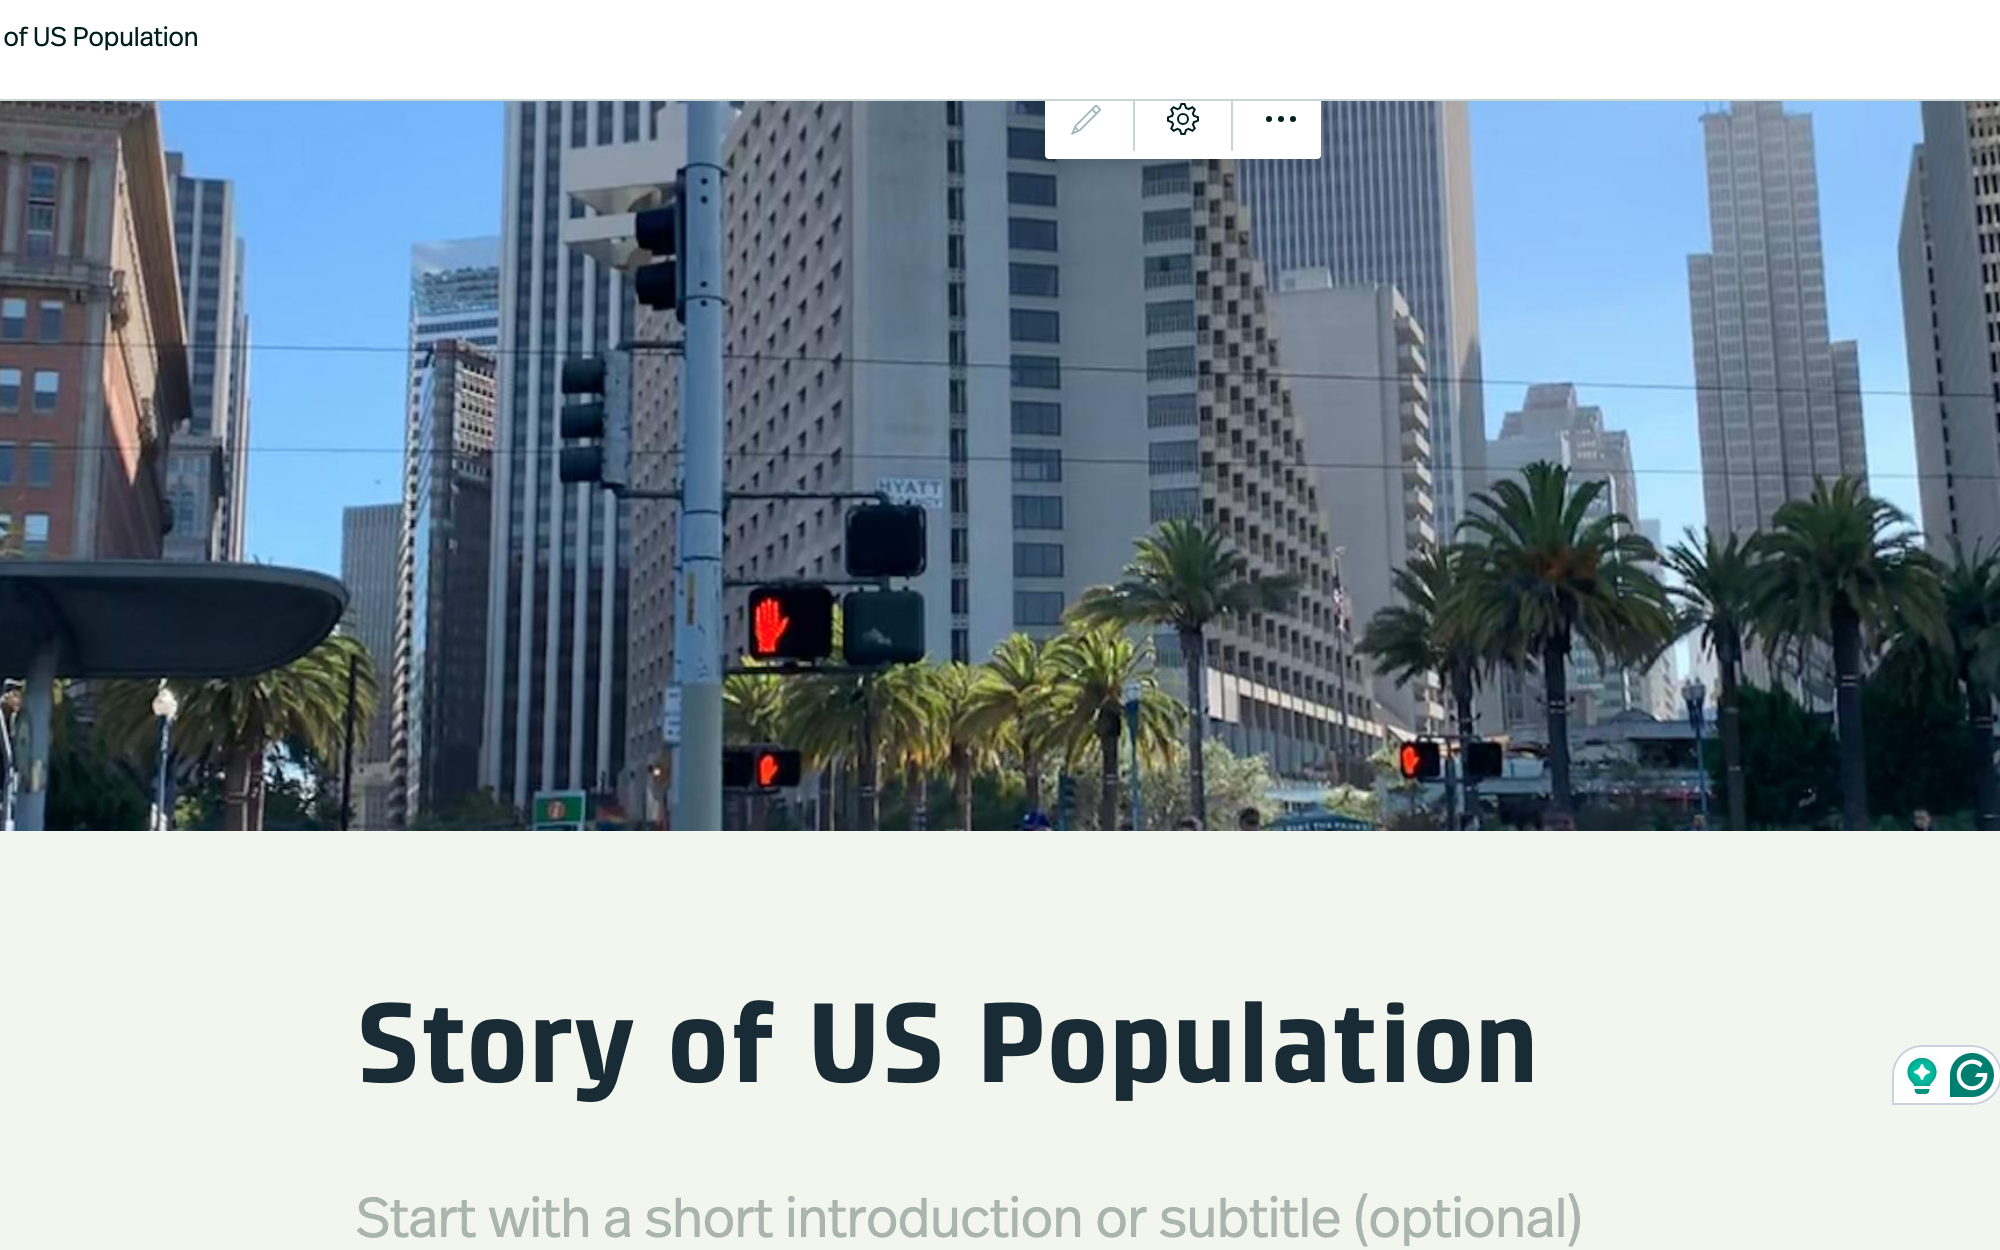
I liked that this tutorial focused on the story aspect of the maps and how to cohesively present a story about the data that is both understandable and interesting. I wasn’t able to figure out how to add the curved arrows on my map, but I figured some of the other stuff out.
Both tutorials gave me examples of what the readings discussed and I thought it was very helpful. Put it all together and into practice. I believe my question about Arcade was answered in Tutorial 2. I appreciated that the tutorials came with all the data and images needed to complete it. I thought that made working through it much easier and almost seamless.
Idea:
One idea I had was (from Chapter 1) to map supermarkets in Delaware and how many average shoppers are there a week. I could use the pop-ups to describe each store and the people that shopped there. I also could use the story feature to illustrate the history of each store and indicate whether it is a chain store or a local one.


