Adjei Week 1

Hello, my name is Josh, and I’m from Maryland. For this week’s assignment, I needed to learn how to access my OWU ArcGIS account. Upon gaining access to my account, I was welcomed by a dashboard displaying the school’s campus maps below. At the top of the screen, I noticed several indexes, including Groups, Content, Organization, and more. Digging deeper, I discovered training resources, such as tutorials on how to master ArcGIS. These tutorials are available in the form of written guides or instructional videos that you can access.


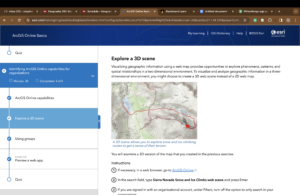
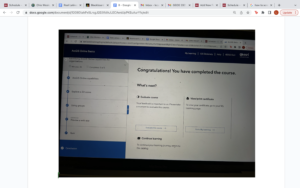
screen shot from web course:
Pois Week 1

My name is Zoie Pois and I am a senior double majoring in Zoology and Environemntal science.

I poked around a bit and looked through the various tabs at the top to see what each one correlated with. Under gallery, there were things from 2020, including this image of floods I didn’t really know happened on campus. 

Under Esri, I was told, “To get connected to My Esri, you need an invitation from your My Esri administrator. This may be your organization’s Primary Maintenance Contact”

I think the mobile aspect of ArcGIS online seems really beneficial for moving around out in the field and collecting data for projects. 

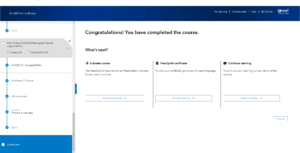
I believe I already completed the remaining things for week 1 during Geog 291

Lauren Campbell Week 1

My name is Lauren Campbell and I am a senior. I plan to graduate in December but recently discovered I was .33 units short of the 34 unit requirement, so I am taking this course so I can graduate! This will be an interesting learning experience for me.

  1. Spend a few minutes poking around your account: 
  • Under “My ESRI,” it says I need an invitation from my ESRI administrator.
  • There are many different training options for the platform, some of which take multiple days (even weeks!) to complete!

2.Use some ESRI resources to learn a bit about ArcGIS Online. Complete a read-through of Get Started: What Is ArcGIS Online.

  • I think map viewer is a cool concept. Especially because it creates interactive maps and provides real-time updates as you work.
  • You can create 3D scenes with accurate distances between two points, generate elevation profiles, change the daylight and weather in the scene, add multiple layers, and include basemaps. This all sounds very complex!

3. Complete a free course that introduces you to ArcGIS Online. 


4. Look into a few GIS application areas. Include, in the blog posting, information on two applications with at least one map or image and a source or two.

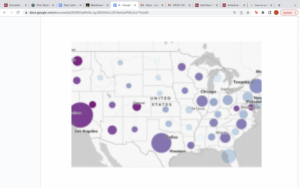
  • The first map demonstrates gender identity and sexual orientation and is owned by Dianaclavery_uo. This layer shows the percent of adults who are LGBT as well as adults whose gender and sexual orientation are not listed on the survey. The color and size of the symbol depicts the percentage and the size depicts the count.
  •  Source:  Household Pulse Survey Data Tables. Data values in this layer are from Week 34 (July 21 – August 2, 2021), the first week that gender identity and sexual orientation questions were part of this survey. Top 15 metros are based on total population and are the same 15 metros available for all Household Pulse Data Tables.

  • I also looked at research called “Music and Place” by Tyler Brown. This person was interested in finding out if references to place in pop music affect our perception of the United States. Their findings suggested that the places most referenced in pop music do not align with where most Americans live, and that more research would be needed to definitively conclude anything else.