Week 5:
Assign: Read and complete (skip chapter 5!) GTKWGIS chapter 6: Spatiotemporal Data and Real-Time GIS: Tile layers and on-premises Web GIS. Create a new blog entry with comments, notes, and questions on these readings. This is: <Your Name> Week 5
- Include a few-sentence description of an application based on ideas from chapters 5 & 6, using your own data or the Delaware Data (from Geog 191). This edition of the tutorial includes ideas under “Assignment” (p. 35 in the 5th edition of the tutorial).
Write-up:
I’d never heard of spatiotemporal data before this chapter so I’m interested in learning more about it. I understand the benefit of “real-time GIS” and how it can be applied to real world problems. I can see how manually entering data or using sensors to immediately have data in a gis program could be super useful. The four types of spatiotemporal data are moving, discrete, stationary, and change data, and I can see how all of these can be applied to real time data based on the examples given in the textbook. The IoT is kind of a scary phenomenon because it consists of such a broad range of everyday things that impact our everyday lives. (ex. “airplanes, taxis, bicycles, lights, refrigerators, sprinklers, heart-monitoring implants, biochips, security cameras, and unmanned automobiles”).
Exercise 6.1, 6.2:
This is my incident dashboard after completing 6.1 and 6.2. This went very smoothly and was enjoyable to do. I like moving things around to make them fit in a way that I liked. There were a few times were it asked me to type a specific title or “something” but just did not include what it was… there was just a blank spot
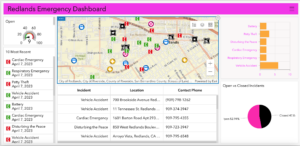
Exercise 6.3:
My dashboard looked mostly the same after 6.3 as it did after 6.2, with the addition of the category selector in the top right and the actions on the 10 most recent incidents tab. I think these are cool functions of the map and added a lot of depth to what it could show.
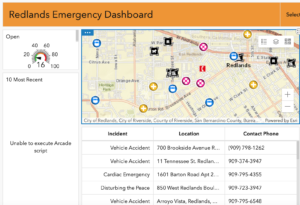
Exercise 6.4:
When trying to type in the Arcade Script, I got this “unable to execute arcade script” in the list box. I don’t feel confident enough in my coding experience to understand what is going on. The same was true with the table arcade script, any time I added anything at all to the advanced formatting box I got the same unable to execute message. I chose to reset to the regular script so that the table and list still displayed the earlier information.
Exercise 6.5:
This exercise went well. No major hiccups. I do find it somewhat more difficult to navigate the arcOnline home pages because I don’t have a ton of experience using them. I think I’m more comfortable in map viewer and other online applications because I have experience with arcGIS on the PC’s.
Exercise 6.6:
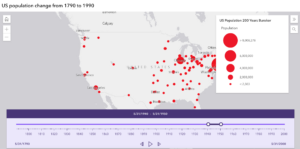
This is my web app created in 6.6. I thought this was straightforward and everything worked well. The instructions were clear and it was cool to see how a web map could become a web app. I feel like this is a useful technique to know how to do and one that I will be able to use going forward. I did see a few more typos similar to the ones that I mentioned above in this exercise, it seems like somehow words were being dropped off the ends of sentences which made it kind of hard to know what the book wanted me to label things.
Potential Application:
I could see myself using the steps from 6.5 and 6.6, making a web map and then turning it into a web app with Dr. Rowley’s Costa Rica data. Part of our goals is to make a web map/app for the town of Bahía Ballena and I could totally follow the instructions and methods we used in these exercises to generate an interactive app that can be shared with the town.