 We had an unfortunate incident with a house guest this weekend. A memeaplogy.
Preface: I didn’t assign this but it’s always good to glance at it.
• stuff about updates to this new edition
• lots of jargon. yeesh.
• the tutorial stuff: go.esri.com/gtkwebgis5
How to Use This Book
• I have, I hope, set up all of your ArcGIS Online accounts for Publisher-level access. You should be able to see that in the information about your account. Also, make absolutely sure you are using your OWUGIS ArcOnline account and not a free account.
• We have full blown access to ArcGIS Onliine so don’t bother with the evaluation or trial versions.
• Downloading the exercise data: URL above; there is lots of stuff, click on Full Book Exercise Data on the left side of the screen.
• it plopped on my Mac Desktop as GTKWebGIS folder, with chapter folders inside. Yay.
Chapter 1: Get started with Web GIS
- workflows: ESRI uses this term ALOT
- I’ll just let you know that I created a crowdsourcing (the public could add data to an online ESRI map) back in 1998 and is summarized (with missing links – it’s so old) as Public Participation Visualization: Conceptual and Applied Research Issues. You all were probably not even born then,
- “Science of Where” – corporate jargon – but lots of interesting applications for sure
- ArcGIS Online (SaaS) vs. ArcGIS Enterprise (I don’t think we have access to the latter, or at least we are not running it)
- emergence of GIS web servers (that’s the research I did in the late 1990s!) I’m old!
- one to two way information flow: that’s me too, back in the olden days
- portal technology: fancy way of getting access to tons of data
- cloud GIS: like custom built mini-GIS software that runs on a broswer (rather than using all of ArcGIS Pro)
- mobile: field work, in vehicles, etc.
- visualization (more of my background; shifting from just viewing data to the idea that you can interact with and think and understand and learn new stuff; tools to do this; 3D, virtual reality, modeling)
- static vs. real time data
- AI and web GIS: scary
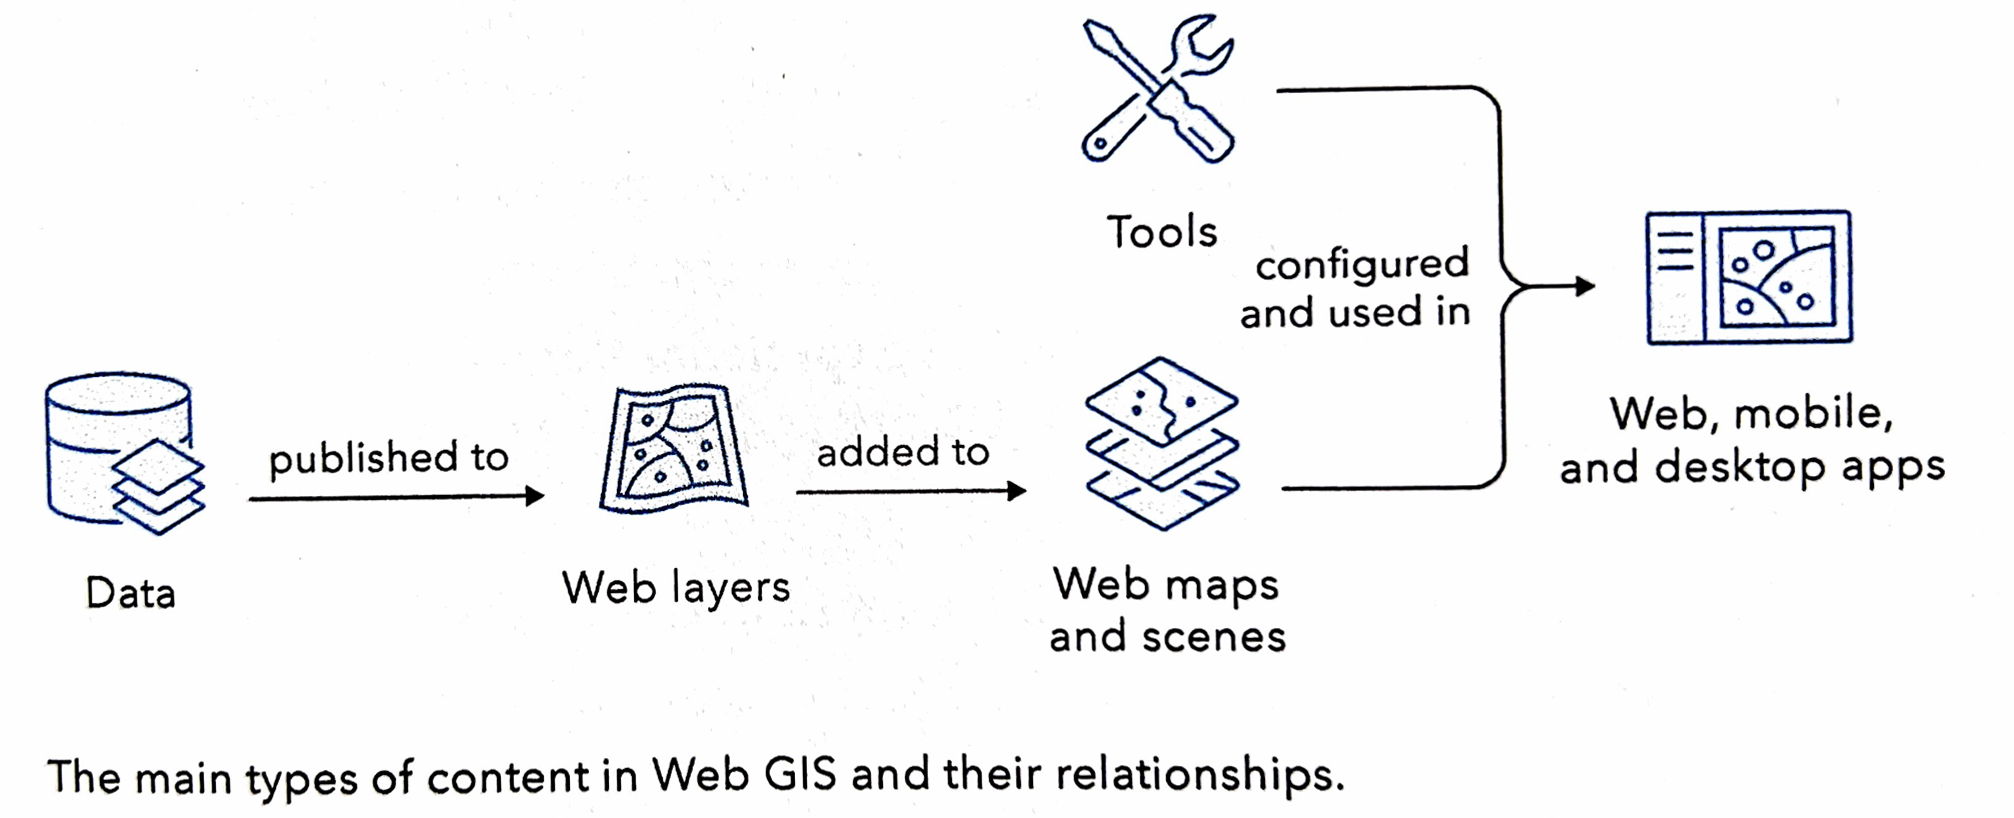
Web GIS Information Model: this is worth looking at a bit more carefully for background
- user privileges: I’m the master of the OWU ArcOnline site and can adjust these privileges for you
- metadata
- sharing
- content: data, layers, tools, webmaps, scenes, apps

- Apps: you can creat these but there are also specialized Apps that ESRI proides. We have some of these, like Drone-to-Map
- ArcGIS User Types
- Basic compenents of a Web GIS app: basemaps (background map stuff), operational layers (data of interest – say mapped out sites of invasive species), tools (function on the operational layers, also sometimes the basemaps)
- Web Services = web layers & web tools (in essence provide users with functionality via the web)
- Feature layers: this is vector data (point, line, area)
- hosted feature layer: hosted by ESRI
- non-hosted feature layer: hosted by user (like you, using OWU site)
- Web maps vs web scenes
- Paths to building Web GIS applications: “workflow” – how you put together applications that users can access via the web using the data and layers and tools and functionality of ArcGIS Online.
- Attachments: for example, we could make a web map application for OWU and Delaware that locates PDFs of projects that focused on those areas, say a PDF about restoring the Delaware Run along the old part of campus, linked to a polygon of that area. Also, images, sounds, etc.
Tutorial 1: Simple map application with attachments.
- some minor glitches but all were easy to figure out

Application: I changed the text on the course schedule:
- Include a few-sentence description of an application based on ideas from chapters 1 & 2, using your own data or the Delaware Data (from Geog 191). This edition of the tutorial includes ideas under “Assignment” (p. 35 in the 5th edition of the tutorial).
- My example application: A map, similar to the one from the tutorial, showing the locations of the ENVS 399 Sustainability Practicum projects for Spring ’23. Proposals (PDF), images (PNG), etc. for each location.
Chapter 2: Smart Mapping and Storytelling with GIS
- web layers, web apps, StoryMaps
- web app workflows for StoryMaps (below)

- feature layers: focus of Ch. 2 is hosted feature layers
- smart mapping: syles illustrated p. 41
- pop-ups
- ArcGIS Arcade: expression languages for adding your own info to data hosted by someone else
- ArcGIS Living Atlas of the World: updated in minutes/hours
- ready to use data created by ESRI and other folks
- incoporate in your own map apps.
- basemaps, imagery, boundaries, human data, infrastructure, environment
- StoryMaps
- uses block formatting (annoying but common for web design)
Tutorial Ch. 2: Web GIS app of population change using ArcGIS Story Maps
- geocoding: address matching (link address or geolocation data – street address, zip code, etc.) to location
- notice (p. 51) that you are using credits! You each have 1000 credits (which cost money – but we get them free as part of our educational deal. If you work for an organization, this is where you spend money doing stuff with ArcGIS Online)

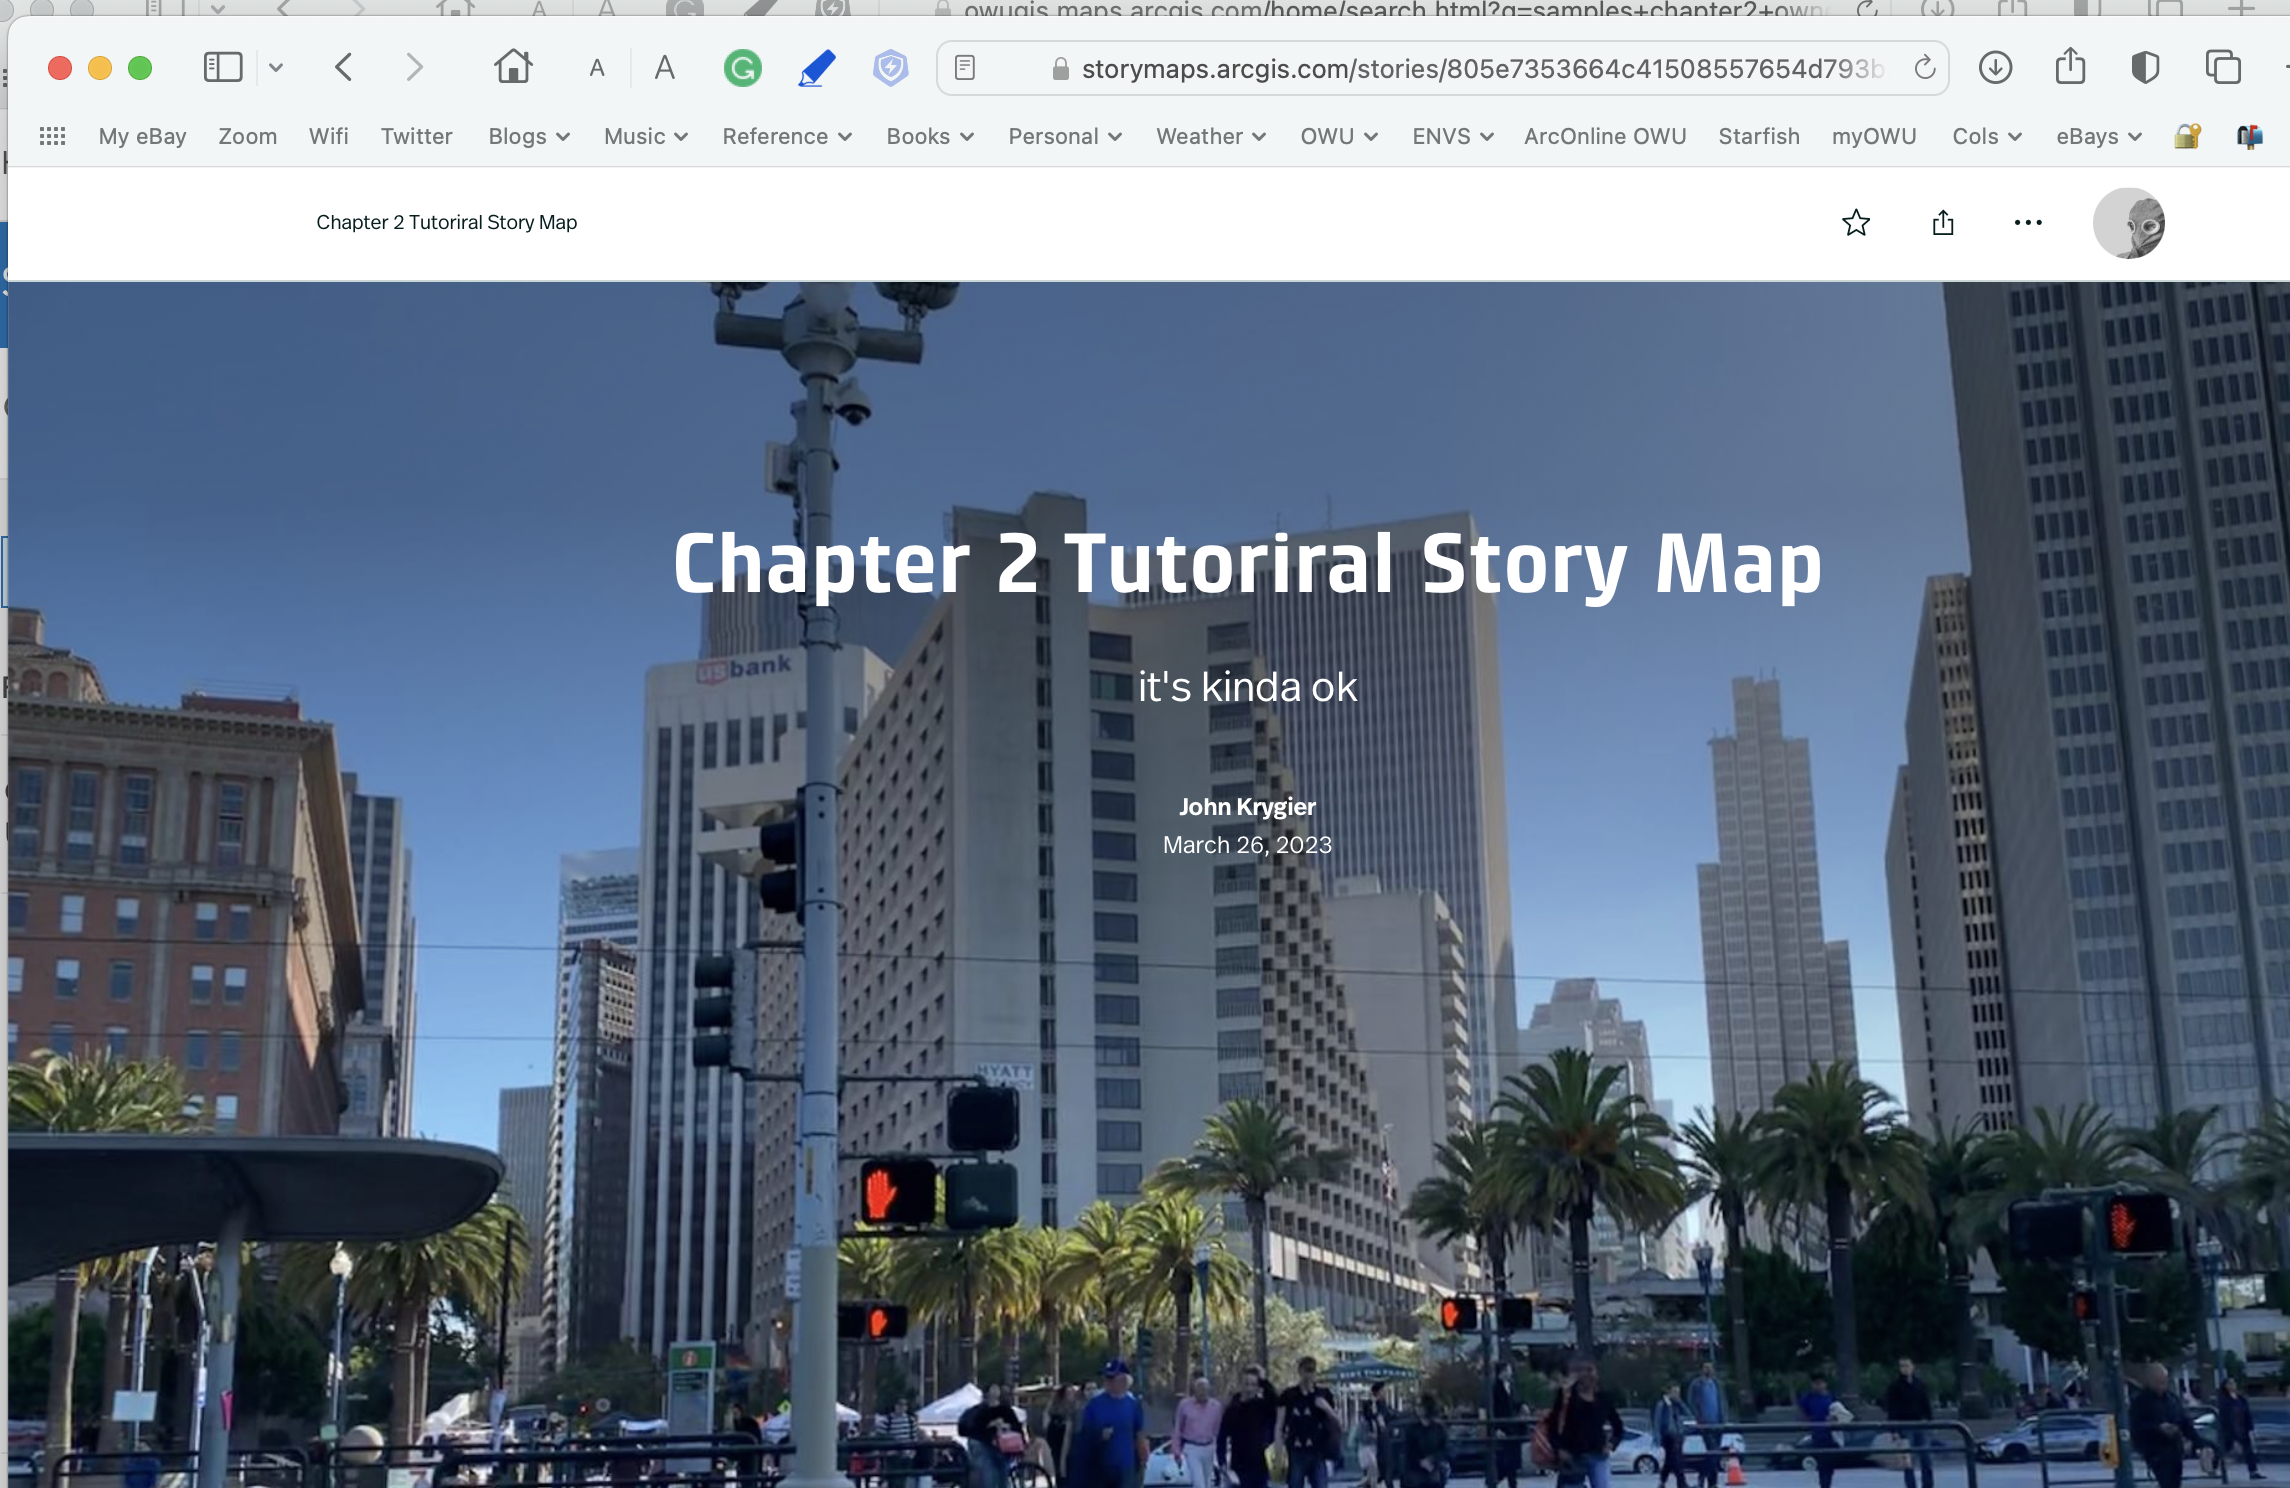
The finished StoryMap: https://arcg.is/fa5Wb1

and so on…

Application: I changed the text on the course schedule:
- Include a few-sentence description of an application based on ideas from chapters 1 & 2, using your own data or the Delaware Data (from Geog 191). This edition of the tutorial includes ideas under “Assignment” (p. 35 in the 5th edition of the tutorial).
- My example application: A Story Map, similar to the one from the tutorial, telling the story of the Chimney Swift Tower project since the idea was first proposed a decade ago with proposals (PDF), images (PNG), information on chimney swift migration (from central America) etc.